
Best Trading Confluence for Day Trading
60sDirectly addresses a common trading pain point with a bold claim, promising a solution that appeals to short-term traders.
▶ Play Clip"The title promises a fast confluence trigger for day trading, and the video delivers a clear, actionable strategy with multiple examples, though it includes some filler and self-promotion."
This video presents a trading strategy for short-term timeframes (M1, M5, M15) that combines Fibonacci retracement levels with previous highs and lows to identify high-probability confluence zones. The presenter demonstrates the method with multiple real-time chart examples, emphasizing the importance of treating these levels as regions rather than exact lines. The strategy is designed for quick trades, such as scalping or options trading, and includes guidance on stop-loss placement and trade management.
The video introduces a confluence strategy for short-term trading, applicable to options, Forex, Crypto, B3, and other markets, specifically for M1, M5, or M15 timeframes.
Confluence occurs when two analyses coincide 100% or almost 100% in a given region. It's not about exact lines but about observing the region where support, Fibonacci retracement, peaks, and indicators align.
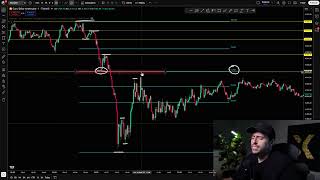
The method involves drawing Fibonacci retracement from the top to the bottom of a thrusting impulse movement within a larger lateral movement. The presenter uses the example of XA USD.
The best confluence levels are 38%, 50%, 61.8%, and 79% (rounded). These are regions, not exact lines, and are where the trader should look for entries.
The preferred confluence is when a Fibonacci level coincides with a top or bottom of the trend used to draw the retracement. This creates a high-probability zone for short-term trades.
A perfect confluence occurs when the bottom of the impulse movement coincides with the 61.8% Fibonacci level, as shown in the example. This provides a strong entry point for a sell trade.
The standard stop loss is placed slightly above the last high (for a sell) or below the last low (for a buy). This is a key part of risk management.
Once the trade is in profit, the stop can be moved to breakeven (entry point) to lock in gains. The trader can then decide to let the trade run or close it for a profit.
The presenter shows several examples of the strategy working, including a buy trade at a 38% confluence and a sell trade at a 61% confluence, both resulting in quick profits.
When drawing Fibonacci, use the body of the candle, not the shadow, especially if there are excessively large shadows (e.g., from news events). It's better to avoid trading in such volatile scenarios.
The strategy also works when a Fibonacci level aligns with a previous peak or high, as shown in an example where the 50% level coincided with a peak, leading to a successful trade.
Another example shows a confluence at the 50% level with two peaks, resulting in a successful trade. The presenter encourages viewers to test the strategy and provide feedback.
The video demonstrates a practical confluence strategy for short-term trading, combining Fibonacci retracement with previous highs and lows to identify high-probability entry points. The method is effective for quick trades and emphasizes the importance of treating levels as regions and managing risk with stop losses.
What is a confluence in trading?
A confluence occurs when two analyses coincide 100% or almost 100% in a given region.
01:19
What are the key Fibonacci levels used in this strategy?
38%, 50%, 61.8%, and 79%.
03:28
What is the ideal confluence for this strategy?
A Fibonacci retracement level coinciding with a top or bottom of the trend used to draw the retracement.
04:25
How should you place a stop loss in this strategy?
Place it slightly above the last high (for a sell) or below the last low (for a buy).
07:15
What should you do once the trade is in profit?
Move the stop to breakeven (entry point) to lock in gains.
07:44
Why should you avoid trading when there are excessively large shadows?
Large shadows often indicate news events or high volatility, making the market unpredictable.
10:33
Definition of Confluence
Provides a clear, actionable definition of confluence, which is the core concept of the strategy.
01:19Key Fibonacci Levels
Identifies the specific Fibonacci levels that are most effective for this strategy, giving traders concrete numbers to use.
03:28Ideal Confluence
Explains the exact condition that creates the highest probability setup, which is the main takeaway of the video.
04:25Stop Loss Placement
Provides a simple, standard rule for risk management that is easy to implement.
07:15Avoiding Large Shadows
Highlights a practical caution about market volatility and news events, which is often overlooked.
10:33[00:02] want to use in the market to start profiting from trading, swing trading, scalping, whether you're going to do short-term or long-term trades. best confluence. And today I'm going to show you, in my opinion, what is
[00:14] especially for those who like to trade on shorter timeframes. So, regardless of whether you're going to trade regardless of whether you're going to trade options, Forex,
[00:26] Crypto, B3, or whatever you're going to do. If you generally use do. If you generally use M1, M5, or M15 timeframes for your analysis, trading, and decision-making, I believe
[00:39] Now, if you use longer timeframes, you might find some other interesting. I have no problem saying this because I don't use what makes sense. And I'm going to show you why, in my opinion,
[00:53] show you why, in my opinion, using Fibonacci, Fibonacci retracement along with a confluence of previous highs and lows of the drawn, is a positive thing. If you enjoyed
[01:06] this video, please give it a thumbs up. If you're not subscribed to the channel, please subscribe. And if I use for day trading, just create your account using the link in the description. Let's go. What is a confluence? Firstly, a
[01:19] confluence occurs when we have two analyses that coincide 100% or almost 100% in a given region. Obviously, when we operate, we don't target an exact region or an exact line. Ah, this support coincides with this
[01:34] coincides with this Fibonacci retracement, this peak coincides with this indicator. You will obviously observe the region, and it doesn't have to be exactly line by line. Beauty? So, with that said, what is my preferred method for using and
[01:51] opinion, what is the best confluence for you to use when trading faster timeframes and Next, you will observe a thrusting movement. It can be a thrusting movement. It can be a large or quick impulse, microulsions
[02:07] within a large lateral movement, okay? Like here, for example. Here we had a great deal of lateral movement. We had some boosts. Downward impulse here upward impulse. That works too. I'm going to show you here, I'm going to give examples, I'm going to
[02:20] explain it to you in various scenarios, okay? This is a somewhat raw video, practically unedited, right? Let me just go back there, I was here at XA USD. Next, let's take the Fibonacci retracement tool
[02:34] , place it here at the top of this movement, and then move it down here, movement, and then move it down here, which is the low point of the momentum, okay? What does every trend-driven momentum movement have? Tops and bottoms
[02:48] , an uptrend, or descending if it's a downtrend. In this case, descending tops and bottoms , OK? As you can see , OK? As you can see here, oh, top, bottom, top, bottom, top,
[03:01] bottom. Right? Here we had another peak, but then we made a higher low than the than the previous high, thus negating that an upward trend will begin, but it does mean the downward trend will end. The market could either
[03:15] sideways. Often, after a strong upward surge, it first moves sideways before seeking a new trend, continuing the previous trend, or continuing the previous trend, or reversing, okay? So, what point do
[03:28] I consider to be one of the best confluences? It's when we have a confluences? It's when we have a Fibonacci retracement that's either at 38% of the Fibonacci level, or 50%, 61.8%, or 79%. Rounding up, right? 38%, 50%, 62%,
[03:43] and 79%. If we were to round them off, because you don't have to be so rigid. The exact line is 61.8% aura projection, biriri boró. Daniice, why? These are the regions where we will be operating, okay? So, from now on, whenever you look at a line
[03:57] in the market, whenever you draw a a rectangle. I really like using these rectangles because every point inside this rectangle would be a point in 38.2, you understand? Up there,
[04:12] this whole area here would be around 50%, and here it would be around around 50%, and here it would be around 61%, okay? And so it goes, okay? So, keeping that in mind, always remember that these are regions, okay? And the confluence
[04:25] I like is when we find one of these Fibonacci points coinciding with a top or bottom of the trend that was used to mark the used to mark the Fibonacci retracement. OK? So what did we have here
[04:40] ? This top here, where that little white line is, see? This top right here. Then we have this other peak here. We have this bottom, We have this bottom, this bottom, this top, and then down below. And that was it
[04:54] , right? There's no need to show it down there . Where did the confluence occur? . Where did the confluence occur? Here, folks, we have a 79-point Fibonacci retracement, and the peak is quite far away, so we don't have a convergence. Up here there's nothing left
[05:07] either, it's already above 79. Where we had a perfect convergence practically at the midpoint of the Fibonacci retracement, which by the way is the most interesting region very good confluence, a sensational confluence, because we had this
[05:23] bottom of the impulse movement that was used to trace the Fibonacci retracement, coinciding with the 61 Fibonacci retracement. And here's an interesting point for sale. real time, let me even point my camera over here, in real time you
[05:38] would be here, look, it made the Fibonacci retracement, the market was going, it was going, okay? It started to rise, surpassed the previous peak, it could be that it's starting a sideways movement or a trend reversal, you stay alert. And I would have already
[05:50] drawn the Fibonacci sequence here. You would have drawn the Fibonacci retracement and already observed the convergence; your entry point would already be set, you just had to wait for it to hit. And the market came, threatened, came very close, and then retreated. If you're only going to step
[06:04] step on that line, you're outside of it, right? So here, because of that point I mentioned about using a region as a whole, at a very good point, a sell trade, obviously, right, in favor of the
[06:20] previous momentum movement, and you would have caught a very short-term trade, right? So here, turning my camera back here, you could have captured a 1-minute, a 5-minute operation, because it hit the mark. You have to understand that this type of
[06:33] confluence is for very short-term operations. So, for those who trade options, for those who are going to do scalping, you understand? Then boom, he went in and bye. He went in, went down, and went out. And then, depending on your management style, you can see how much
[06:47] risk-return you're willing to put on the table. You can do it with risk and return, and it's either up or down, it doesn't matter. Okay? And it can even serve as a trigger. If you do want to extend this operation. For example, if you get the timing right on
[07:03] an entry, that's very good. Why? You entered here, placed the stop up there , for example, above the previous high, right? Beauty. That's the standard, okay? If you're unsure where to place your stop loss, here's how: you
[07:15] take your position, enter the market, and place your stop loss slightly above the last high or low, which would be right here. The last peak was here. So you put the stop a little bit above it here, see. Ready. Right? And then the
[07:31] interesting thing is what happens next, because since this specific pattern has a high accuracy rate you in the short term, in the next few minutes, to start making a profit, you can
[07:44] reposition your stop to the point where you entered here, the market started to fall, you caught it, it went down here, you move the stop to zero. So, my son, you decide what let the operation run its course, then go ahead. You
[07:56] want to close the deal with a profit, so when you get back here, do whatever you want, okay? What matters is that I'm showing you the best confluence trigger for quick trades. The way you conduct
[08:11] your operation is up to you. Beauty? Next, I'm not just going to show one example, I'm going to show more, okay? Here we had this upward momentum movement. It could also be used . Yes. Let's see. I'm going to pull here
[08:25] . Yes. Let's see. I'm going to pull here from the lowest point up there to the highest. Right? And here, just by glancing at it , I can see the following: , I can see the following: Here, look. Bottom, top, bottom,
[08:38] top. Right? Here, bottom, top. That's an bottom, top. That's an interesting scenario. Why? This bottom here, if you look at the Fibonacci retracement, it's at the high of this
[08:53] this other candle here. So, we can consider that this region isn't exactly a bottom within this movement, but okay, let's consider it as if it were an exact confluence of this bottom
[09:08] with the 38-fold Fibonacci retracement, right? Then the market came, and soon after that red candle went down. A purchase transaction would have taken place here. And you can see that 2 minutes later the graph had already gone up. Ah, but it only went up that much. Okay,
[09:22] will most likely become positive . What are you going to do next? As I said before, everyone operates in the way they think is best. That's because trade options, and options without getting in are already lost . Just wait a minute, two
[09:36] minutes, and the operation will be finished. Right? So, this would have been in line with what I like, getting it right in the very short term, right? So he showed respect. Down here we had another confluence region, and the 61st is the strongest region
[09:50] confluence region, and the 61st is the strongest region . Look at the confluence of this peak arriving here along with the 61 of Fibonacci. See? So once again, a confluence at 61. It touched but didn't go over. Right after that, oh, he showed
[10:03] respect and went up. Do you see? So, once again , it would have been successful. Now I'm going to look at the very short-term trends. Why? It's way we identify tops and bottoms will be a little different,
[10:17] had this upward surge. Fibonacci retracement, same thing, from minimum Fibonacci retracement, same thing, from minimum to maximum. I just don't put it on the maximum obviously I just don't put it on the shadow and I put it on the body. When we have an
[10:33] excessively large shadow. If this shadow here was... damn, up here, that must have been some news, right? Something happened there. consideration. It's even better not to operate when you have scenarios like this, with
[10:47] really big, crazy shadows, okay? But in this case, we had this But in this case, we had this movement. And when you movement. And when you trade in this way, observe each
[11:00] of the candles. So here, what would be a top and a bottom, so to speak, would be the red candles. And the candles, if it's an upward trend, right? Those would be the red candles. So we consider this a minimum here. Here, in a
[11:14] top-tier region, there were two or three umbrellas in the same price range, already considered equal here, look, two umbrellas here, minimum here, look, we umbrellas here, minimum here, look, we had this whole range here and this
[11:29] had this whole range here and this region. OK? That being said, the market went up, then started to fall. Does 38 have a confluence? It does not have. 50 converges here, look. 50 is very close to this top, look.
[11:43] See? So, we have a confluence of this previous peak with the 50% Fibonacci retracement level. The market came, touched, and rose, showing respect. See? Let's use respect. See? Let's use
[11:58] Fibonacci here now for this momentum. Right? How interesting! You didn't respect the interesting! You didn't respect the 38 here, OK? Take a look here. 38 went straight through. Why did he respect the number 50? Look at the confluence here, where it meets the maximum light of
[12:12] this red candle. See? So here we have another scenario, a very short-term one. Bang, boom, that's it . And you can see that there are many
[12:25] different scenarios in which this happens, okay? There are several scenarios in which this happens. And what's also interesting is that when we don't have that top and bottom we don't have that top and bottom visibly, the minimum viable way is to
[12:38] red candle, one green candle in the middle of the path. When we don't have that, we won't operate in that way. But look how interesting, an upward impulse that didn't have a red candle. So here you wouldn't have a confluence
[12:51] here you wouldn't have a confluence looking at this moment, this is just the might find a point of convergence, but there wasn't one here. Right? You can see that just as it went up, it came down again . OK. Let me
[13:05] find another point of convergence here . Impulse from down here. Pull here. Pum. Throw it down there. Beauty. From that point all the way down. Where do we point all the way down. Where do we have the regions? Top, bottom, top. It's
[13:21] bottom, top. Where do we find a point of convergence, everyone? As the market started to recover here, there's a confluence of 38, there isn't. There's a convergence at 50, there's this peak, these two peaks with the 50 Fibonacci retracement level. Look where he showed respect
[13:36] once again, right at the intersection, okay? So this is just a small example, a small demonstration of how this trigger with this confluence is
[13:48] sensational for any market. If you already knew about this, comment below. If you have any questions, leave a comment, try it out, come back here, and give me your feedback. you guys too, okay? I hope you enjoyed the video, leave a like. If
[14:02] you're not subscribed to the channel yet, please subscribe.



⚡ Saved you 0h 14m reading this? Transcribe any YouTube video for free — no signup needed.