
How I Made 2600% Profit on Weex
45sThe promise of huge profits with a step-by-step breakdown is highly clickable and appealing to aspiring traders.
▶ Play Clip"The title promises a step-by-step guide to a profitable trade, and the video delivers exactly that, with clear explanations and real examples."
The video presents a step-by-step guide to taking profitable trades on the Weex platform, using two real examples with high returns. The creator explains market structure, order blocks, and the importance of risk-to-reward ratios, while also promoting a $10,000 to Christmas challenge with signals.
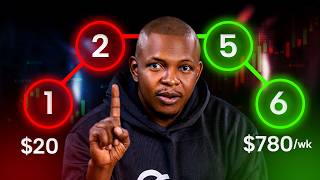
The video showcases two trades with returns of 2,600% and 1,749%, but clarifies these are risk-to-reward ratios of 5:1 and 4.49:1, respectively.
Weex offers various bonuses: a 10-to-100 coupon for KYC, a $30 futures bonus, and a $200 daily bonus based on trade volume, which can be used for funding fees or margin.
The creator explains market structure: impulsive moves and retracements, and how to identify break of structure to determine trade entries.
The entry point is identified by finding a supply zone (for shorts) or demand zone (for longs) that aligns with a fair value gap and an order block.
Using the Ethereum chart, the creator demonstrates the process: identify impulsive moves, retracements, and breaks of structure, then drop to lower time frames (1H, 30m) to refine entry with the 200 moving average.
The Bitcoin trade was taken the same day, with a risk-to-reward ratio of 4.49:1, and the creator shows live trades every Monday.
To join the $10,000 to Christmas challenge, viewers must sign up on Weex via the link and join the Telegram channel; the challenge starts December 1st with signals every other day.
What is the difference between an impulsive move and a retracement?
Impulsive moves are the strong price movements in the direction of the trend, while retracements are the counter-trend pullbacks.
04:22
What is a break of structure in market structure analysis?
A break of structure occurs when the body of a candle closes beyond a previous high or low, confirming a trend continuation or reversal.
10:27
What is a fair value gap?
A fair value gap is the space between the wick of one candle and the wick of the next, indicating an imbalance in price.
08:24
What is an order block?
An order block is the last candle before a fair value gap, which acts as a supply or demand zone.
08:53
What is a risk-to-reward ratio?
The risk-to-reward ratio is the potential profit relative to the potential loss, e.g., 5:1 means risking $10 to make $50.
03:22
Trade Risk-to-Reward Ratio
Clarifies that the 2,600% figure is misleading; the actual risk-to-reward ratio is 5:1, which is more realistic and educational.
03:22Market Structure Basics
Explains impulsive moves and retracements, foundational concepts for identifying trade entries.
04:22Fair Value Gap and Order Block
Demonstrates how to identify a fair value gap and the resulting order block, a key entry signal.
08:24Using the 200 Moving Average
Shows how the 200 MA is used as a confirmation tool on lower time frames.
12:10Live Trade Demonstrations
Mentions that trades are shown live every Monday, adding credibility and a learning opportunity for viewers.
14:08[00:03] I took on Wix. [music] This one is 2,600% 2,600% and this other one is 1,749%. [music] By the end of this video, you will be able to take trades like this
[00:16] because I'm going to show you exactly how I took these two trades step by step. And what you will realize is that they are actually very simple to take. Even a new trader can do this once you understand the setup. And if you don't
[00:33] even want to do analysis at all yourself, I am starting [music] a $10,000 to Christmas challenge where I'll be dropping signals like this almost every other day. The goal is to hit $10,000 by December 25th. I'll give
[00:48] you full details on how to be part of this as we progress in this video. So again, these are the two trades that I took on wigs. Now, in my last video, I don't think I shared this. If you click above here where it says $10,000, if I
[01:02] click on it, you will see lots of bonuses. So, this one is 10 to 100 coupon. And you get this by verifying your phone number and also completing your phone number and also completing KYC. If you go further down, this one is
[01:16] futures bonus. So, you have $30. You also have $200. You can get this per day depending on what your trade volume is. And this
[01:28] future bonus, you can use it to pay your funding fees. You can even use it as funding fees. You can even use it as margin from it and even withdraw the money which is amazing. If I go back and click on promotions, there are several
[01:43] events and airdrops that is happening [music] in weeks. Each time you come here, you will see events that you can take part in. Look at this one here. The VIP Gala airdrop. This one is just one day left. So it must have ended [music]
[01:57] when you are seeing this video. Then if you take note of this one for P2P traders, this is [music] becoming a verified Wix P2P merchants. Wix don't have Naira yet in their P2P. They want to include this soon. So becoming
[02:12] verified will make you one of the pioneers of Naira P2P in Wix. if you can do that and take advantage of this opportunity since many people are now moving to Wix in Nigeria and it will just get you positioned. I also said in
[02:27] like about Wix is the ability to stack your trades, meaning you can take This is a [music] unique feature that helps you maximize your opportunity. I
[02:39] helps you maximize your opportunity. I explained all this the stacking and some of the beginner tutorial on wigs [music] in my last video. So go and watch that video. You really understand how to set up your account properly to take
[02:53] profitable trades on wigs. I'll leave that video in the description of this particular video. Now let's look at how I [music] took this trade on weeks. Okay, so this is the trade. It is a 2,600%
[03:08] um trade. But don't get confused with this. This is the entry. This is the closing price. Now, so you don't get confused with this percentage. This is really what happened in this trade. I'm going to tell you now. This trade is
[03:22] going to tell you now. This trade is actually a fivehour trade. Meaning it has a risk ratio of five. Meaning that whatever I risk in this trade, I got five times of it. So, if I risk $10, that is $50 in profit. If I risk $100,
[03:39] that is $500. And $1,000 will give me $5,000. [music] This is what it really is. So, don't get confused with this percentage. This is what matters. And I will show you how we got that [music] in this video. Now, to
[03:53] market moves. For a downtrending market, because this is a short trade, the because this is a short trade, the market moves like this. up down up down up like this. Okay. For an uptrending market, it is the opposite way. The
[04:07] market, it is the opposite way. The market moves this way, up, down, up, down, this way. So, this is what is called market structure. Now, the movement downward is called an impulsive move and the movement upward is called a
[04:22] move and the movement upward is called a retracement move. Impulsive retracement. Impulsive retracement. Impulsive retracement. The same thing for this for an uptrending market. The movement upward is called the impulsive move
[04:36] retracement. So in this case impulsive retracement, [music] impulsive retracement like that. Where we target to enter trades for a downtrending market are these places like this is
[04:49] where we want to enter a trade. Here is where we want to enter a trade. Like that for an uptrending market. These are the places want to target to enter a trade. Now if you watch this movement for the downtrending market, the
[05:04] impulsive move made a break of structure to the downside. downside like that. Another break to the downside. For an uptrending market, it
[05:19] downside. For an uptrending market, it is the same case, but the impulsive move is the same case, but the impulsive move is making a break of structure to the is making a break of structure to the upside. It's as simple as that. So, we
[05:31] upside. It's as simple as that. So, we have impulsive moves, retracements, impulsive break structure, retracement, impulsive break structure. Now, how do we know the exact place to enter this particular trait? like this one and this
[05:46] one. How do we know the exact place to enter these trades? The same thing for trades here. How do you know the exact place to enter this trade? What we are going to do is to look for what we call the order
[06:01] block that is the supply and the demand zone. For a downtrending market, we are looking for supply zone around this place [music] to enter the trade. So we look for supply zone around here to enter the trade for an uptrending
[06:15] market. What we're now looking for is demand zone. We're looking for a demand zone that aligns with our this [music] point to enter trade. So demand zone. This is where we just enter the trade. This is it. Really, really simple. Now
[06:30] let's go to the real chart. So I'll show you how to do this in a real chart. Now this is an Ethereum chart. This is the trade that I actually took. >> And I'm going to show you these things I've talked about here. So we are on the
[06:45] 4hour time frame right now. If you look at this, this is impulsive move, retracement, impulsive move to this point, [music] retracement, impulsive
[06:57] move. So we should see a retracement to keep going further down. It's as simple as that. So the place we look for trades are simply here. You can see that here
[07:09] Simple, right? So, how do we know the exact point? Just like I mentioned, want exact point? Just like I mentioned, want to trade around here, around here, and around here. Okay. So, how do we know the exact
[07:24] points? This is a downtrending market. So, look for supply zone. Now, supply zone, let's look at this. If you zoom into this section, okay, this particular section, let's study this candles here. So, we have
[07:41] candle one. This candle here, this one, the green candle rather, let's call it the green candle rather, let's call it candle one. And this black candle here is our candle two. And this black candle
[07:54] at the bottom here, it's our candle three. Now if you look at this between this is the wick of candle one this where it ended [music] this is the wick of candle three this way ended so there's a space you see candle one week
[08:09] and candle two week did not meet because of this gap here we call this gap that of this gap here we call this gap that is here a fair value gap.
[08:24] below [music] and you see what a break or structure just like I said earlier or structure just like I said earlier this movement down here like this is a this movement down here like this is a breakout structure because of this we
[08:37] see the gap here we saw a breakout structure this then becomes an order block so the candle before the fair value gap is what we now call the order block I'm going to mark it out now. So this
[08:53] green candle here is our order block. But sometimes what I do is I like to extend it even to the black candle. This black candle at the bottom here and cover this. But the actual other block
[09:08] is this green candle here. So I can extend it all the way to this way. Okay. I can take this to the top and extend it all the way here. So this becomes what our supply result. You can
[09:25] see as price came up to that point what happened? It just retraces down again. Another place we can experience it is this one here.
[09:40] see how the chart tap into it and went all the way down. Okay. So now what you should be looking at is this particular one. This is also an other block here.
[09:58] And this one too is an other block. So we should expect price to do what? To come up this way and go down this way. But now let's look at this this particular one. Is this a break of structure? Right? So we should
[10:12] expect this to happen. And we should expect a movement up breakout structure before we see this. But so is this a break of structure? No, this is not a break of structure because this is a weak. The body of the candle has not
[10:27] closed yet. So it's still [music] a week. Now if I go back here and look at week. Now if I go back here and look at this one, [music] had it been this came down to this point and went up without it is not a breakoff structure.
[10:42] It only became a break of structure when the whole of this a candle body closed very [music] well below it and start going up. If it were just this a week then I won't call it a break [music] structure and this particular trade
[10:58] would have not worked. So the same thing here we expect this candle to move further down before coming up to this point. [music] So therefore what do we do? We'll go down again to a lower time frame. So
[11:11] this this is now the 1 hour time frame that I'm heading to. So this is the 1 hour time frame. So what do I expect? I expect a movement [music] downwards. Okay, before going up.
[11:26] But if you look here, which [music] is in the 1 hour time frame, you will also see that there is an internal break or structure here.
[11:41] valid breakout structure and this is the demand zone that led to it. This particular candle is a demand zone or the supply zone rather that led to this breakout structure because it's so small. I like to cover the whole of it.
[11:55] [music] Now, now the next thing is that I'm going to go down to the 30inut time [music] frame to see how I can start taking my trade. So on a 30 minutes time frame, this is also where I apply my [music] 200 moving average. So what I
[12:10] want to do is to adjust [music] this to this point. It looks fine. And here I can also choose to go down to 15 minutes time frame if I want to or take my trade trades from here. This is a short position. From here I entered at about
[12:27] 3211. My stop loss is above here and my takerit was at this low, this particular low. So this was the trade I set. You
[12:39] can see [music] that the risk-to-reward ratio is 5.16. This a 5 hour risk-to-reward ratio. Let's see how this played out.
[12:59] So it is really [music] as simple as this market structure demand zone make sure we have a break of structure confirm with the 200 moving average and that is it you have a trade and this is also the same way I took the Bitcoin
[13:15] trade exactly [music] the same way as I'm making this video the same way as I'm making this video this is actually a trade I took today you can see the same thing um [music] we had a break structure this Okay,
[13:29] retracement. Then this is literally as I'm making this video. As a matter of fact, let me check my trade and show you. So in this particular trade I'm in right now, this is my first take profit. This is my second takerit. So you can
[13:43] see this one now, this one is the one I took just now and it's the same process. took just now and it's the same process. This one we are at about a,000%. But in the real sense, it is also a risk ratio of 4.49.
[13:56] So putting a a $100 here will give you $449. $1,000 will give you $4,490.
[14:08] trades like this. And the crazy [music] thing is that I actually show this trade live every Monday. I do analysis live on Monday. If you watch my live last particular trade I showed you for Ethereum was done live and you could
[14:25] have taken this trade live with me. Now, let's talk about how to join the $10,000 to Christmas challenge where I actually give you signals every other day to Christmas with the goal of hitting $10,000 uh by [music] Christmas. I
[14:40] simply drop the signals and you trade with me. The first step is to sign up to Create a Wix account using [music] the link in the description of this video. This is very very important. Step two is to join my Telegram signal channel. You
[14:56] will also see the link in the description of this video. Please do not go to Telegram and search for Judo Mano or search for Aibi. [music] There are so many scam groups. The only legit one is the one in the description of this
[15:10] video. So, this is how the challenge is going to go. The calendar starts December 1st but before then I will start adding people to that particular group the last week or November is going
[15:22] to be an interactive group where you can you know talk you talk back the current communicate there but in the challenge you can communicate and ask questions you can communicate and ask questions once the challenge starts entry will
[15:35] once the challenge starts entry will close. So, take the action now if you want to drink along with me um all the way to December 25th.
⚡ Saved you 0h 15m reading this? Transcribe any YouTube video for free — no signup needed.