
AI Summary
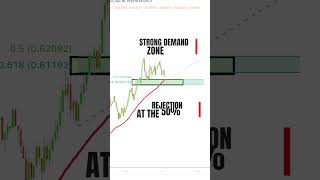
The video presents a concise trading strategy based on three converging technical factors: a strong demand zone, a rejection at the 50% Fibonacci level, and the 50-day moving average acting as dynamic support. The presenter claims this confluence signals a high probability of an upward move, offering a high reward-to-risk ratio.
Chapters
The strategy identifies a robust demand zone, a rejection from the 50% Fibonacci level, and the 50-day moving average as dynamic support. These three factors together create a confluence signal.
The 50-day moving average consistently prompts market bounces when price reaches it, serving as a dynamic support level.
When the market reaches and rebounds from this setup, it signals a more than 99% likelihood of an upward move, according to the presenter.
Following the rejection, the market surged upwards, confirming the analysis and providing a high reward-to-risk ratio.
The video teaches a simple confluence trading strategy combining demand zones, Fibonacci retracement, and moving averages to identify high-probability trades. It emphasizes the importance of waiting for multiple factors to align before entering a trade.
Mentioned in this Video
Tutorial Checklist
Study Flashcards (3)
What are the three converging factors in this trading strategy?
easy
Click to reveal answer
What are the three converging factors in this trading strategy?
A strong demand zone, rejection at the 50% Fibonacci level, and the 50-day moving average as dynamic support.
00:03
What does the 50-day moving average act as in this strategy?
easy
Click to reveal answer
What does the 50-day moving average act as in this strategy?
Dynamic support that prompts market bounces.
00:18
What probability does the presenter claim for the setup?
medium
Click to reveal answer
What probability does the presenter claim for the setup?
More than 99% likelihood of an upward move.
00:32
💡 Key Takeaways
Confluence of Three Factors
Introduces a clear, repeatable framework for identifying high-probability trades.
00:03Claimed 99% Success Rate
A bold claim that, while unsubstantiated, highlights the perceived strength of the setup.
00:32Full Transcript
[00:03] about pinpointing three converging factors that highlight a level strength take a look here we've got a robust demand Zone plotting Fibonacci levels reveals a clear rejection from the 504 Fibonacci level Additionally the 50-day
[00:18] moving average serves as a dynamic support level consistently prompting Market bounces upon reaching it so we have three factors of Confluence a strong demand Zone rejection at the 50 Fibonacci level the 50-day moving
[00:32] average acting as Dynamic support when the market reaches and rebounds from this setup it's a prime opportunity to take the trade this combination signals a more than 99 likelihood that the market will move upward let's see what
[00:47] happened next as expected following this rejection the market surged upwards confirming our analysis and providing a high reward to risk ratio if you want to high reward to risk ratio if you want to learn more download your ebook the link