
Why Most Traders Fail at ICT?
45sThis clip hooks viewers by admitting the struggle with ICT concepts and promises a simple breakdown, which is highly relatable and drives curiosity.
▶ Play Clip"The title promises a simple breakdown of smart money concepts, and the video delivers exactly that with clear explanations and chart examples."
This video breaks down core smart money trading concepts from ICT, including liquidity, fair value gaps, the power of three, and order blocks. It explains how institutions hunt retail stop-losses and how traders can align with institutional order flow for higher-probability setups.
Liquidity refers to areas on the chart with clusters of pending orders, mainly stop-losses. Smart money knows where retail traders hide stops and aims to collect them.
Buyside liquidity consists of buy stop orders above price (e.g., above previous highs). Sellside liquidity consists of sell stop orders below price (e.g., below previous lows).
In a range, price spikes above resistance to trigger breakout buys and stop-losses from shorts, then reverses back inside the range—a classic buyside stop hunt.
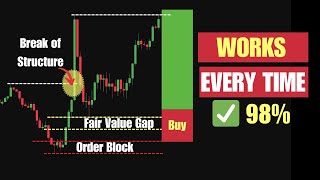
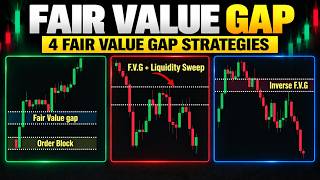
A fair value gap is a price imbalance created when the market moves aggressively, leaving an unfilled gap between candles. It acts as a magnet for price to retest.
Look for three consecutive candles: a strong middle candle sandwiched between two smaller ones. If the high of the first and low of the third do not overlap the middle candle, a gap exists.
1) Use only unmitigated gaps. 2) Larger gaps offer stronger setups. 3) Avoid gaps near major resistance/support. 4) Focus on gaps right after a break of structure.
The pattern segments price action into three phases: consolidation (smart money builds positions), manipulation (false breakout to trap retail), and acceleration (sharp move in the true direction).
An order block is a zone where institutional traders placed large buy or sell orders, causing an impulsive move. Price often revisits these zones for a retest.
Order blocks are based on aggressive moves (not multiple rejections), marked as thicker zones, and typically offer a one-time opportunity once mitigated.
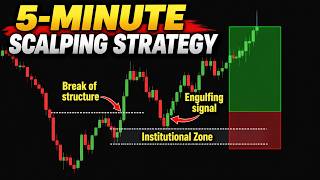
1) Must have an imbalance (gap). 2) Must be untouched (unmitigated). 3) Must lead to a break of structure or change of character.
Mastering liquidity, fair value gaps, the power of three, and order blocks allows traders to think like smart money and avoid retail traps. These concepts provide a framework for identifying high-probability entries based on institutional activity.
What is liquidity in smart money trading?
Liquidity refers to areas on the chart where there are clusters of pending orders, mainly stop-losses.
01:11
What is buyside liquidity?
Buyside liquidity consists of buy stop orders placed above price, typically above previous highs or equal highs.
01:40
What is a fair value gap?
A fair value gap is a price imbalance created when the market moves aggressively in one direction, leaving an unfilled gap between candles.
04:17
How do you spot a fair value gap?
Look for three consecutive candles: a strong middle candle sandwiched between two smaller ones. If the high of the first and low of the third do not overlap the middle candle, a gap exists.
04:59
What are the three phases of the power of three pattern?
Consolidation, manipulation, and acceleration.
07:26
What is an order block?
An order block is a zone on the price chart where major institutional traders have placed a large number of buy or sell orders, causing an impulsive move.
11:25
What are the three rules for a valid order block?
1) There must be an imbalance (gap). 2) The order block must be untouched (unmitigated). 3) There must be a break of structure or change of character.
14:16
How does a buyside liquidity trap work in a range?
Price spikes above resistance, triggering breakout buys and stop-losses from shorts, then reverses back inside the range.
03:04
What is the difference between order blocks and support/resistance?
Order blocks are based on aggressive moves by institutions, marked as thicker zones, and typically offer a one-time opportunity. Support/resistance are based on multiple rejections, drawn as lines, and can be respected multiple times.
12:47
What should you do if price returns to an order block and touches it?
Consider the order block mitigated and move on to the next setup, as the original orders have likely been filled.
15:23
Liquidity as Stop-Loss Magnets
Explains the foundational concept that smart money targets retail stop-loss clusters.
01:11Fair Value Gap Definition
Introduces a key tool for identifying price imbalances that act as magnets for retests.
04:17Power of Three Pattern
Provides a clear three-phase structure to understand smart money manipulation before trends.
07:26Order Blocks as Institutional Footprints
Teaches how to identify where big players entered the market for high-probability entries.
11:25Three Rules for Valid Order Blocks
Offers a strict filtering system to avoid false signals and increase trade accuracy.
14:16[00:00] ICT concepts are powerful, but let's be honest, most traders struggle to understand them. Liquidity, fair value gaps, order blocks, they're often explained in a way that feels complicated, even overwhelming.
[00:12] In this video, you'll finally understand the core of smart money trading, broken down simply. You'll learn what liquidity really is and how institutions use it against retail traders, the secret behind fair value gaps, and how to trade them with confidence.
[00:27] The Power of Three and How Smart Money Sets Traps Before Big Moves How to Spot and Trade Valid Order Blocks Like a Pro and most importantly, how to apply these concepts using real chart examples, step by step.
[00:40] By the end of this video, you'll be able to spot liquidity traps and avoid getting stopped out. Trade fair value gaps and order blocks with confidence. Recognize smart money patterns like the Power of Three. Build entries based on real institutional activity, not guesses.
[00:53] If you're ready to stop trading like the crowd and start thinking like smart money, make sure to like the video, subscribe and hit the notification bell so you never miss a strategy breakdown. Let's get started. Let's start with the foundation of all smart money concepts, liquidity.
[01:08] Liquidity refers to areas on the chart where there are clusters of pending orders, mainly stop losses. These zones are like magnets for smart money. They know exactly where most retail traders hide their stops and they aim to collect them.
[01:22] Here's how they do it. You buy at support, right? You place your stop loss just below it. The market dips, stops you out, then flies up.
[01:34] Sound familiar? That's not a coincidence. That's a liquidity hunt. And it's how price is engineered, not random. To trade like smart money, you need to identify where liquidity is resting. ICT breaks it down into two categories.
[01:47] The first type is buy-side liquidity. Buy-side liquidity refers to buy-stop orders. and these are typically placed above price, above previous highs, weekly or daily highs, or above equal highs.
[02:00] Why are they up there? Because traders who are short want to protect their positions. They place stop losses above swing highs. Breakout traders also place buy stops to catch a move higher.
[02:13] Smart money knows this, so they push price just above these highs to trigger those stop losses, fill their own sell positions using that spike in demand and reverse the market. This is what's called a buy-side liquidity grab.
[02:26] Now let's flip the script. Sell-side liquidity comes from sell-stop orders and they rest below price, below previous lows, weekly or daily lows or under equal lows. Long traders place stop losses below key support.
[02:40] Breakout traders place sell stops to catch a breakdown. Smart money sees the same thing. So what do they do? push price below support, trigger those stops, fill their buy positions using that flood of
[02:53] sell orders, and reverse the market upward. This is the essence of a sell-side liquidity grab. Now that you understand how liquidity works, let's take a closer look at two common liquidity traps you've probably seen before. Let's start with a buy-side liquidity trap.
[03:08] Take a look at this chart example. The market is in a range. You see a clear resistance level looks like the perfect spot to go short. So you enter a sell trade, placing your stop just above resistance. Meanwhile, breakout buyers are stacking buy stops above the same level,
[03:23] expecting a bullish breakout. But guess what happens? Price suddenly spikes above resistance, stops out the sellers, and triggers the breakout buys. Then it snaps back inside the range. Both sides are wiped out. That entire move, it was just a liquidity sweep.
[03:36] A classic buy side stop hunt in a range-bound market. Alright, now let's break down a sell side liquidity trap. Here's what it looks like. The market is trending down. You spot a solid support level.
[03:48] You go long, expecting a bounce. Stop loss is below support, of course. At the same time, breakout traders are stacking sell stops below that level, betting on a breakdown. Price breaks down, triggers both sets of orders, then reverses back up.
[04:10] Again, both groups are trapped. The real move starts after the liquidity is cleared Now let dive into a key concept smart money traders use to pinpoint precise entries and exits the fair value gap So what exactly is a fair value gap
[04:29] It's a price imbalance that happens when the market moves aggressively in one direction, so quickly that it leaves behind an unfilled gap between candles. This gap represents an area where price didn't spend enough time,
[04:41] and as a result it often acts like a magnet, pulling price back for a retest. Traders use these gaps to find high-probability entry zones, and, when used correctly, they can give you sniper-level precision.
[04:53] To spot a fair value gap, start by looking for a sequence of three consecutive candles. You're looking for a strong middle candle, one that clearly moves in one direction, sandwiched between two smaller candles. Here's the key. If the high of the first candle and the low of the third candle do not overlap with the middle candle,
[05:09] then a gap exists. That space between the first candle's high and the third candle's low is what we call the fair value gap. Once you find it, draw a rectangle over that zone on your chart. That's your area of interest.
[05:22] This works both ways. In bullish setups, the gap is created as price pushes upward. In bearish setups, the gap appears as price drops rapidly. Just remember, if there's no gap between the first and third candles, there's no valid fair value gap, no matter how large the middle candle is.
[05:38] Let me share four practical tips I use to filter out the noise and focus on the best setups. Tip number one, use only unmitigated gaps. The best fair value gaps are fresh, meaning price hasn't returned to test them yet.
[05:51] Once price comes back and touches the gap, that zone is considered mitigated. Its edge weakens. So if you spot a fair value gap that has already been retested, it's better to skip it. Also, watch out for price that retraces too deep.
[06:04] If it closes inside or below the gap, the setup becomes invalid. Ideally, you want price to tap the gap, respect it, and bounce. Tip number two, size matters. Larger fair value gaps generally offer stronger setups.
[06:19] Why? Because a wider gap indicates a more aggressive imbalance between buyers and sellers, which makes it more likely that price will revisit and react from that zone. When you have multiple fair value gaps on the same chart, prioritize the bigger ones.
[06:33] Tip number three, watch out for fair value gaps near major levels. Here's a common trap. You spot a beautiful fair value gap, but it forms right underneath a major resistance level. That's a red flag. Why?
[06:45] Because price may reach that resistance, reject hard, and invalidate your fair value gap. It's always smart to check your surroundings. Avoid fair value gaps that appear too close to obvious barriers like support and resistance.
[06:58] Tip number four, focus on fair value gaps that form right after a break of structure. Some of the most reliable fair value gaps form right after a break of structure. When price breaks a key level and immediately leaves behind a fair value gap,
[07:12] that zone becomes a high probability area for smart money to re-enter. The first retest of this fair value gap often triggers a strong reaction. Now let's move on to another powerful ICT concept, the power of three.
[07:25] The power of three is a smart money trading pattern that segments price action into three key phases. Consolidation, manipulation, and acceleration. Let's start with the first phase, consolidation.
[07:37] During the consolidation phase, smart money begins quietly building positions while price moves sideways within a tight range. To the average trader, the market looks indecisive or stagnant, but in reality, this phase is critical.
[07:50] It lays the foundation for the next major move. This is the first stage in what's often referred to as the power of three. Next comes the manipulation phase, where the market fakes a breakout to the downside or upside.
[08:02] This move is designed to trap retail traders by triggering stop losses and luring in breakout traders. It's a classic liquidity sweep, engineered to collect orders from unsuspecting participants.
[08:14] A liquidity sweep typically occurs when price dips below a clear support level and then snaps back into the range. This false breakout isn't a true shift in trend. It's a smart money tactic to gather liquidity before the real move begins.
[08:27] Once enough liquidity has been captured, smart money drives price rapidly in the opposite direction. This sharp move is known as the acceleration phase. This final phase is where momentum kicks in. And this is your opportunity to enter after the trap with the institutions Catch this acceleration and you no longer chasing the move you riding it That was the bullish version of the power of three Now let break down the bearish version This one plays out at the end of an uptrend a setup for downside momentum
[08:55] Here's how it unfolds, beginning with the first phase, distribution. Price consolidates, forming a tight range, but behind the scenes, smart money is offloading their long positions, selling into strength while retail buyers pile in. Next comes the manipulation phase,
[09:10] price suddenly breaks above the range, triggering breakout entries and stop losses from short sellers. Retail thinks it's a continuation, but it's not. It's another trap. Price quickly returns inside the range, revealing the move for what it was, a liquidity sweep.
[09:25] Finally, we enter the markdown phase. Smart money has exited, liquidity has been swept, and there's nothing left but empty space below. This is your moment to catch the trend from the very top, riding the momentum smart money just created. Now let's talk about how to actually
[09:39] trade the power of three, both bullish and bearish setups. Once you know how to spot it, the next step is timing your entry, managing your risk, and targeting your exit like a pro. When the market is in an uptrend, smart money will eventually begin taking profits.
[09:53] Here's what to look for. First, wait for distribution. Price starts to range after a strong move up. This is where smart money starts offloading positions. Then comes manipulation. Price breaks above resistance, triggering breakout buys and swap losses from sellers.
[10:09] Watch closely. If price closes back inside the range after that breakout, that's your signal. It's a liquidity sweep, not a true breakout. Your entry is on the close of the candle that returns inside the range.
[10:21] Place your stop loss just above the high of the breakout candle. Your target? The next major support level. This setup lets you ride the mark down, the acceleration phase to the downside, after smart money has tracked retail traders.
[10:39] When the market is trending down, smart money eventually looks for a place to start buying. Here's how to spot the reversal.
[10:52] Watch for the accumulation phase. Price begins to range after a strong downtrend. Then comes the liquidity grab. Price drops below support, triggering sell stops and drawing in breakout sellers. If the next candle closes back inside the range, that's your entry signal.
[11:07] The trap has been set. Smart money is loading up. Enter at the close of that candle. Set your stop loss just below the recent swing low. Aim for the next significant resistance level as your target. This is your chance to catch the markup,
[11:19] the explosive move upward powered by institutional momentum. Now let's move on to another key smart money concept, order blocks. Let's break it down in simple, powerful terms. An order block is a zone on the price chart where major players,
[11:32] like banks, hedge funds, and other institutional traders, have placed a large number of buy or sell orders. These are not your everyday traders. These are entities with millions, sometimes billions of dollars at their disposal.
[11:45] So when they enter the market, their impact is visible. Have you ever seen price shoot up or drop sharply from a specific level with force? That sudden move is often not random. It's a footprint of smart money.
[11:57] And the zone where that move originated is what we call an order block. There are two main types. A bullish order block is formed when institutions place large buy orders, pushing price upward. A bearish order block happens when they unload large sell positions, causing price to drop.
[12:13] Once these zones are formed, they become areas of interest. Why? Because price often comes back to revisit them. It's as if the market wants to test whether those big players are still interested in defending their position.
[12:25] And for us, that retest can offer a high probability entry. For instance, if price returns to a bullish order block and shows signs of strength, entering a buy trade from that zone can lead to solid profits. because you're aligning yourself with the same level where the pros previously stepped in.
[12:42] Order blocks might look like support and resistance at first, but the difference is huge. Let's break it down. At first glance, order blocks might look a lot like your typical support and resistance levels. After all, both highlight areas where price reacts.
[12:56] But once you understand how they work, you'll see they're very different beasts. Let look at three key differences that set them apart Support and resistance zones form after price rejects a level multiple times For example if price bounces off a level once then again later that repeated rejection gives us a reason to draw a support or resistance line
[13:16] But order blocks? They're not based on rejection. They're born from aggressive moves made by big players. If you see a strong, impulsive price move away from a level, that's your clue. That area becomes an order block, because smart money likely entered the market there.
[13:31] Support and resistance are usually represented by horizontal lines. Sometimes traders expand them into narrow zones, but they're still fairly thin. Order blocks, on the other hand, are marked as thicker zones. They represent a cluster of institutional activity, not just a line in the sand.
[13:46] This wider area reflects where orders were stacked, not where price just touched and bounced. Support and resistance levels can be respected again and again. Price might bounce off a strong support level five times over weeks.
[14:00] Order blocks don't work that way. They're more like a one-time window of opportunity. Once price revisits an order block and reacts, that area often loses its power. Why? Because the original orders that caused the move have likely been filled.
[14:13] The smart money has done its job and moved on. Before you can use order blocks in your trading strategy, you need to know how to spot the right ones. Let's walk through the three essential rules that define a valid order block.
[14:25] These aren't optional. They're the backbone of this strategy. Rule number one, there must be an imbalance, also known as a gap or inefficiency. Not every strong move marks an order block. What sets a valid one apart is imbalance.
[14:38] A stretching price where there wasn't enough time or liquidity for the market to trade fairly. You'll often spot this as a gap between candle wicks. Let's break it down. Imagine two price moves that look almost identical. Both push upward strongly.
[14:51] But in one there's a clean space, a gap, between the high of one candle and the low of the next few. That gap is an inefficiency. It shows the market moved so fast, orders weren't fully matched.
[15:03] Only the move with this imbalance can be considered for an order block. To draw it, take the last candle before the imbalance appears and draw a rectangle from the wick high to wick low. That's your zone. Rule number two.
[15:15] The order block must be untouched. In other words, it has to be unmitigated. Order blocks don't last forever. In fact, they're usually one-shot opportunities. If price returns to the zone, even if it's just a wick tapping it, that order block is
[15:29] no longer valid, it's been mitigated. Why? Because the orders that were sitting there have likely been filled. Smart money has already acted. So when you draw an order block, keep your eye on it. The moment price touches it, consider it used, and move on to the next set up.
[15:44] Okay, rule number three. There must be a break of structure or a change of character to confirm the order block. This is the most important part. Without it, all you've got is a guess. A valid order block must lead to a shift in market structure.
[15:57] That means, if the trend is up, the price should break above a previous high. If the trend is down, it should break below a previous low. If the trend flips direction entirely, it should show a change of character. Here is an example.
[16:10] You could say, here, the market made a strong move down, and we can clearly see an imbalance, so this looks like a potential order block. But for this order block to be valid, we need confirmation through a break of structure.
[16:23] Specifically, a breakout below the previous support level. Now look at what happens next. The market breaks below that support, which confirms the order block as valid. And once price retraces back into the order block, it gets rejected and continues moving
[16:37] down. Now look at another example. This time, the market moves up and breaks market structure. As you can see, here's the first imbalance. So we draw our first order block. we notice another imbalance forming higher, so we mark a second order block.
[16:51] What's important is that this second order block aligns with a previous resistance level, which adds confluence and increases the probability of a strong reaction. Watch what happens next.
[17:07] The market retraces back into the order block, gets rejected, and then continues moving higher, confirming that the order block was valid and supported by the the former resistance now acting as support. That's it for today's video on ICT concepts.
[17:21] If you found it helpful, don't forget to like, subscribe and turn on notifications so you never miss the next strategy breakdown. Thanks for watching and I'll see you in the next video.
⚡ Saved you 0h 17m reading this? Transcribe any YouTube video for free — no signup needed.