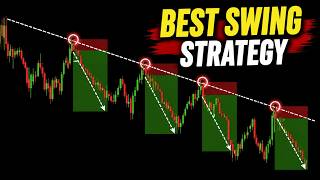

My #1 Swing Trading Strategy
44sDirectly introduces the core strategy, promising actionable rules and mistakes to avoid, which hooks traders looking for a proven method.
▶ Play Clip"Solid, structured tutorial that delivers on its promise of a step-by-step guide, though it could be more concise."
This video presents a comprehensive guide to the trend line pullback swing trading strategy, covering entry, stop loss, and take profit rules, along with four common mistakes and a six-point checklist for identifying high-probability setups. The strategy is demonstrated with multiple real chart examples across different currency pairs.
The trend line pullback strategy is a trend-following approach that works on Forex, stocks, indices, cryptocurrencies, and commodities. It helps traders enter high-probability trades without chasing the market.
Financial markets don't move in a straight line. During an uptrend, buyers push prices higher before taking profits, causing temporary pullbacks. If the trend remains strong, new buyers step in during these pullbacks, creating another impulsive move higher. The strategy aims to enter during these retracements.
The first step is to identify a clear uptrend (higher highs and higher lows) or downtrend (lower highs and lower lows). Avoid sideways markets because trend line strategies perform best in trending conditions.
Draw a trend line by connecting swing lows in an uptrend or swing highs in a downtrend. The line should connect at least two significant swing points without forcing the line to fit the price. The more times the market respects the line, the more reliable it becomes.
Never chase the market after a strong impulsive move. Wait patiently for price to retrace back to the trend line, which allows for a better entry price and a smaller stop loss.
When price reaches the trend line, don't enter immediately. Wait for a bullish confirmation candle in an uptrend or a bearish one in a downtrend. Examples include engulfing patterns, hammers, shooting stars, or pin bars. Enter at the close of the confirmation candle to reduce false signals.
For long trades, place the stop loss below the most recent swing low; for short trades, above the most recent swing high. The take profit can be set at the next major support or resistance level, or you can trail the stop loss to capture larger moves.
Trading on the daily time frame allows you to spend only 15-20 minutes after the New York session closes to scan for setups, place your orders, and walk away.
A common mistake is forcing the trend line to fit the price, especially to connect a third touch. This changes the angle and ignores previously respected swing lows. The market defines the trend line, not the trader. If there isn't a clear line, move on.
Entering immediately when price touches the trend line is a mistake because price might break straight through. Waiting for a confirmation candle to close provides much greater confidence that buyers or sellers have stepped back in.
Before taking a daily trade, check the weekly chart. If the weekly trend is aligned with the daily setup, the probability of success increases. If the weekly chart is in a downtrend or approaching major resistance, it's better to skip the trade.
Before taking any trade, ask: 1) Is the market in a strong trend? 2) Is the trend line valid? 3) Has price made a clean pullback? 4) Does the weekly chart support the trade? 5) Is there a strong confirmation candle? 6) Is there enough room to the next major level for a good risk-to-reward ratio?
The video concludes with a full walkthrough of a trade using the checklist. The key takeaway is that successful traders don't take every trade; they only take the best ones, following a consistent checklist without emotions or guesswork.
The trend line pullback strategy is a systematic approach to swing trading that relies on patience, discipline, and a clear set of rules. By following the six-point checklist and avoiding common mistakes, traders can significantly improve their probability of success and avoid emotional trading decisions.
What is the core idea of the trend line pullback strategy?
It is a trend-following strategy that allows you to buy or sell after a temporary pullback to a trend line, instead of entering during the initial breakout, to achieve a better entry price, tighter stop loss, and higher risk-to-reward ratio.
00:58
What are the two conditions for identifying a clear uptrend?
The market should be making higher highs and higher lows.
02:06
How many significant swing points should a valid trend line connect?
At least two significant swing points, without forcing the line to fit the price.
02:31
What is the purpose of waiting for a confirmation candle before entering a trade?
Waiting for a confirmation candle helps reduce false signals and confirms that buyers or sellers have regained control, increasing the probability of a successful trade.
02:58
Where should you place your stop loss for a long trade?
Below the most recent swing low.
03:38
What is the first mistake that can ruin the trend line pullback strategy?
Forcing a trend line to fit the price, especially to connect a third touch, which changes the angle and ignores previously respected swing lows.
08:27
Why is it a mistake to enter a trade as soon as price touches the trend line?
Because price might break straight through the trend line and continue moving against you. Waiting for a confirmation candle provides greater confidence that buyers or sellers have stepped back in.
09:07
What is the purpose of checking the weekly chart before taking a daily trade?
To ensure the higher time frame trend is aligned with the daily setup, which increases the probability of a successful trade. If the weekly chart is in a downtrend or approaching major resistance, it's better to skip the trade.
09:59
List the six questions in the checklist before taking a trend line pullback trade.
1) Is the market in a strong trend? 2) Is the trend line valid? 3) Has price made a clean pullback? 4) Does the weekly chart support the trade? 5) Is there a strong confirmation candle? 6) Is there enough room to the next major support/resistance level for a favorable risk-to-reward ratio?
11:22
The Core Principle
Explains the fundamental logic of why entering after a pullback improves entry price and risk-to-reward ratio.
00:58Valid Trend Line Definition
Provides a clear, objective rule for drawing trend lines, which is crucial for the strategy's success.
02:31The 'Forced Trend Line' Mistake
Highlights a common psychological pitfall where traders try to make the market fit their bias, leading to invalid setups.
08:27Top-Down Analysis
Emphasizes the importance of multi-timeframe analysis to confirm the trend and avoid counter-trend trades.
09:59The Six-Point Checklist
Provides a systematic, repeatable framework for trade selection, removing emotion and guesswork.
11:22[00:01] favorite swing trading strategies, the trend line pullback strategy. This strategy is simple to learn, works on Forex, stocks, indices, cryptocurrencies, and commodities, and helps you enter high probability trades
[00:15] chasing the market. Before we get started, let me show you what you'll How to trade one of my favorite swing trading strategies from start to finish. The exact entry, stop loss, and take profit rules I use. The four mistakes
[00:30] that can ruin this swing trading strategy. A simple checklist to identify high probability trading setups. How to apply this swing trading strategy using real chart examples. Before we dive in, if you enjoy videos like this,
[00:44] subscribe to the channel, and turn on the notification bell so you never miss a new trading strategy and other price action tutorials. Now, let's get started. The trend line pullback strategy is a trend following strategy
[00:58] that allows you to buy or sell after a temporary pullback instead of entering large move. Instead of chasing the trend, you wait well-respected trend line, and then look for a candlestick confirmation that
[01:12] buyers or sellers are stepping back into the market. By entering after the pullback, you can often achieve a better entry price, a tighter stop loss, and a higher risk to reward ratio than traders who enter during the initial breakout.
[01:25] So, why does this strategy work? Financial markets don't move in a straight line. During an uptrend, buyers push prices higher before taking profits, causing temporary pullbacks. If the overall
[01:37] trend remains strong, new buyers often step in during these pullbacks, creating another impulsive move higher. The opposite happens during a downtrend. Sellers drive prices lower. A temporary rally follows, and then selling pressure
[01:50] returns, pushing prices down again. The trend line pullback strategy is designed retracements and join the prevailing trend at a better price. Now, let's look at the exact trading rules. The first step is to identify a clear uptrend or
[02:06] downtrend. In an uptrend, the market should be making higher highs and higher lows. In a downtrend, it should be making lower highs and lower lows. Avoid markets that are moving sideways because trend line strategies perform
[02:19] best in trending conditions. The second step is to draw a valid trend line. Once you've identified the trend, draw a trend line by connecting the swing lows in an uptrend or the swing highs in a downtrend.
[02:31] Your trend line should connect at least two significant swing points without forcing the line to fit the price. The more times the market respects the trend line, the more reliable it becomes. The third step is to wait for the pullback.
[02:44] Never chase the market after a strong impulsive move. Instead, wait patiently line. This allows you to enter the trend at a better price while keeping your stop loss relatively small. The fourth step is to wait for a confirmation
[02:58] candle. When price reaches the trend line, don't enter immediately. Wait for uptrend or a bearish confirmation candle in a downtrend. Examples include a bullish or bearish engulfing pattern, a hammer, a shooting
[03:12] star, or a bullish or bearish pin bar. These candlestick patterns suggest that the pullback may be ending and that the main trend is ready to resume. Enter the closes. Waiting for the candle to close helps
[03:26] reduce false signals and confirms that buyers or sellers have regained control. For long trades, place your stop loss below the most recent swing low. For short trades, place it above the most recent swing high.
[03:38] fluctuate while protecting your capital if the trend reverses. You can set your take profit at the next major support or resistance level. Alternatively, you can trail your stop loss as the trend develops to capture larger moves. Now
[03:52] strategy, let's look at some real chart examples to see how it works in different market conditions. This is the British pound versus the Japanese yen on As you can see, the market is in a strong uptrend. We draw a trend line by
[04:07] connecting the swing lows. Here's the first touch, and here's the second first touch, and here's the second touch. Now let's see what happens next. trend line, and as soon as it reaches it, buyers step in reject lower prices
[04:22] forming a bullish pin bar. This is our confirmation candle. We enter the trade at the close of the pin bar, place our stop loss below the recent swing low, and set our take profit at the next major resistance level. Now look at what
[04:34] major resistance level. Now look at what happens. target. One of the biggest advantages of this strategy is that you don't have to spend hours watching the charts. Since we're
[04:49] trading on the daily time frame, all you need to do is open your charts after the New York session closes, spend 15 to 20 minutes scanning for setups, and see if a trend line pullback has formed. If you find a valid setup, simply place
[05:02] your entry, stop loss, and take profit, then walk away and let the market do the example. This is the British pound versus the US dollar on the daily chart. As you can see, the market makes an impulsive move higher followed by a
[05:17] pullback and then another impulsive move. This sequence of higher highs and higher lows confirms that the market is in a clear uptrend. Now let's draw our trend line by connecting the swing lows. Here is the first touch, and here is the
[05:29] second touch. Let's see what happens next. Price retraces back toward the trend line, and as soon as it reaches it, buyers reject lower prices forming a doji candlestick pattern. This rejection
[05:42] suggests that selling pressure is fading and that the pullback may be coming to an end. We enter the trade at the close of the doji candle, place our stop loss slightly below its low, and set our take profit at the next major resistance
[05:54] profit at the next major resistance level. Now, look at what happens. uptrend and reaches our target as expected. Now, let's look at a bearish
[06:06] This is the US dollar versus the Swiss franc on the daily chart. As you can see, the market makes an impulsive move lower, followed by a pullback, then This sequence of lower highs and lower lows confirms that the market is in a
[06:21] Now, let's draw our trend line by first touch, and here is the second touch. Now, look at what happens next.
[06:37] line and gets rejected, forming a long-tailed bearish rejection candle. This rejection suggests that buyers are losing momentum and that sellers may be ready to take control again. We enter the trade at the close of the
[06:50] rejection candle, place our stop loss just above its high, and set our take profit at the next major support level. Now, look at what happens. As you can see, the market resumes the downtrend and reaches our target as
[07:03] expected. Now, let's look at another chart example. This is the euro versus the US dollar on the daily chart. As you can see, the market makes an impulsive move lower, followed by a pullback, and then another impulsive move lower. This
[07:17] confirms that the market is in a clear downtrend. Now, let's draw our trend line by connecting the swing highs. Here is the first touch, and here is the second touch. Now, let's see what happens next.
[07:33] line, gets rejected, and forms a clear bearish engulfing pattern. This is our confirmation to enter the trade. We enter the trade at the close of the bearish engulfing candle, place our stop loss above the recent swing high, and
[07:46] support level. Now, look at what happens. downtrend and reaches our target as expected. Now, let me tell you something
[08:00] important. If two traders use exactly the same trend line pullback strategy, one of them may consistently make money while the other keeps losing. So, what's the difference? The difference isn't the strategy, it's how they execute it. The
[08:14] profitable trader avoids a few critical mistakes that most beginners make, while the losing trader repeats them over and over again. Let's look at the four mistakes that can completely ruin this strategy. One of the biggest mistakes
[08:27] beginners make is forcing a trend line to fit the price. As you can see here, we have a clear uptrend. This is the first touch, and this is the second touch. By connecting these two swing lows, we get a valid
[08:39] trend line. The mistake many traders make is trying to force the trend line to connect the third touch. As you can see, doing so changes the angle of the trend line and causes it to ignore the previous swing lows that the market
[08:51] clearly respected. Remember, the market defines the trend line, not you. If you make it fit every new swing, it's probably not a valid trend line. If there isn't a clear and obvious trend line, simply move on to another chart.
[09:07] opportunity. Another common mistake is entering the trade as soon as price touches the trend line. Just because the market reaches the trend line doesn't mean it will respect it. Sometimes, price breaks
[09:19] straight through the trend line and continues moving against you. confirmation candle before entering the trade. As you can see on this chart, price pulls back to the trend line, but instead of buying immediately, we wait
[09:33] for a bullish confirmation candle. Once the confirmation candle closes, we enter the trade with much greater confidence that buyers have stepped back into the market. The same principle applies to bearish setups. Wait for a bearish
[09:45] sell trade. Being patient for a single candle can be the difference between entering a high probability trade and getting caught in a false move. Waiting for confirmation won't eliminate losing trades, but it
[09:59] ones. Another mistake many traders make is ignoring the bigger picture. Before taking any trade on the daily time first. Look at this chart example. As you can
[10:14] see, the market is in a steady uptrend and we have a valid trend line. This is the first touch. This is the second touch. And this is the third touch. the third time, it forms a bullish pin bar suggesting that the pullback may be
[10:28] over and that buyers are stepping back into the market. But before entering the trade, let's switch to the weekly chart. As you can see, the weekly chart is also bullish. Price has pulled back to this trend line and formed a strong bullish
[10:41] rejection candle indicating that buyers are still in control on the higher time This means the weekly trend is aligned with our daily setup increasing the probability of a successful trade. Now let's switch back to the daily chart. We
[10:55] bullish pin bar, place our stop loss below the recent swing low, and set our take profit at the next major resistance level. As you can see, the market moves higher and reaches our target. If the weekly chart had been in a clear
[11:09] downtrend or approaching a major weekly resistance level, it would have been better to skip this trade and wait for a setup where both time frames are aligned. Now that you know how to trade this strategy and the mistakes to avoid,
[11:22] let me show you a simple checklist that can dramatically improve your trade selection. Before taking any trend line pullback trade, I I go through these six questions. First, is the market in a strong trend?
[11:35] highs and higher lows for an uptrend or lower highs and lower lows for a downtrend. Second, is the trend line valid? It should connect at least two clear swing points without forcing the line to fit the price. Third, has price
[11:49] made a clean pullback to the trend line? Never chase the market after a strong impulsive move. Be patient and let price come to you. Fourth, does the weekly chart support the trade? Always perform a top-down analysis before entering a
[12:02] Ideally, the weekly time frame should be not be approaching a major support or resistance level. Fifth, do you have a strong confirmation candle? Wait for a bullish or bearish
[12:15] engulfing pattern, a pin bar, a hammer, or another clear rejection candle before entering the trade. Finally, is there enough room to your distance to the next major support or resistance level. If the potential
[12:28] reward doesn't justify the risk, simply skip the trade. questions, you've found a high probability setup. If even one answer is no, stay patient and wait for the next
[12:41] opportunity. Remember, successful traders don't take every trade. They only take the best ones. Now, let's put everything together with one final chart example. The first question I ask myself is, is the market
[12:54] in a strong trend? As you can see, the market is making a series of higher highs and higher lows, so the answer is yes. Next, is the trend line valid? We connect these two clear swing lows, and as you can see, the market has
[13:07] respected this trend line multiple times without forcing it to fit the price. Now, has price made a clean pullback to the trend line?
[13:19] market retraces back to the trend line, giving us the opportunity to join the trend at a better price. The fourth question is, does the weekly chart support the trade? Let's switch to the weekly time frame. As you can see, the
[13:32] weekly chart is also bullish and isn't approaching a major resistance level. This tells us that the higher time frame is aligned with our daily setup. Now, let's switch back to the daily chart. The fifth question is, do we have a
[13:44] strong confirmation candle? Yes, as soon as price reaches the trend line, it confirming that buyers are stepping back enough room to the next resistance level? Yes, the potential reward is much
[13:59] greater than the amount we're risking, giving us a favorable risk-to-reward ratio. Since every item on our checklist has been confirmed, this is a high-probability setup. We enter the trade at the close of the bullish
[14:11] engulfing candle, place our stop loss below the recent swing low, and set our take profit at the next major resistance level. Now, look at what happens.
[14:26] uptrend and reaches our target. This is exactly how I analyze every trend line pullback setup. I don't take trades based on emotions or guesswork. I simply follow the same checklist every time and only enter the market when all
[14:39] conditions are met. That brings us to the end of this video. If you found it helpful, don't forget to like this video, subscribe to the channel, and turn on the notification bell so you never miss a new trading strategy.
[14:52] Thanks for watching, and I'll see you in the next video.

⚡ Saved you 0h 14m reading this? Transcribe any YouTube video for free — no signup needed.