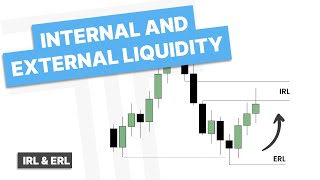

Internal vs External Liquidity Explained
54sThis simple breakdown of core ICT concepts is highly educational and hooks viewers looking for a clear trading edge.
▶ Play Clip"Title accurately describes content; the video delivers a clear explanation and examples of the internal–external liquidity relationship."
This video explores the relationship between internal and external range liquidity, defining internal as a fair value gap (FVG) and external as a swing high or low (buy side or sell side liquidity). The core pattern is that after price takes external liquidity, it seeks internal liquidity (FVG), and after reaching internal liquidity, it reaches for external liquidity again. This cycle can be used across multiple timeframes to determine daily bias and find entries.
The video will cover the relationship between internal and external range liquidity, starting with a PDF before moving to TradingView examples.
Internal range liquidity is a fair value gap (FVG). External range liquidity is a swing high or swing low (buy side or sell side liquidity).
After taking external range liquidity, price will seek internal range liquidity (FVG). After reaching internal range liquidity, price will reach for an old high or old low (external range liquidity).
On the S&P weekly chart, price failed to displace below an old low. It then retraced into a FVG (internal) and from there reached for external liquidity (old low).
After price entered internal liquidity (FVG) on the weekly, if respected, it continued to external liquidity (old low). If not, it would target a different external level.
After taking external liquidity, if price inverts (fails to displace below the previous bar), bias can shift bullish. The relationship helps determine narrative.
On the 60-minute gold chart, price respected a FVG and was targeting the old low (external). This provided a short bias.
On the 5-minute chart, after price displaced into a FVG, a high was put in within the FVG. Dropping to the 1-minute chart, an order block entry was identified with a stop above the high, targeting the hourly low.
On GBPJPY, after taking an old high (external), internal liquidity was a FVG ahead. The plan was to go from external to internal to new external high.
After price reached internal liquidity (FVG) on the 4-hour chart, a change of state of delivery (shift over a high) signaled a shift from sell to buy model, targeting the weekly external liquidity.
The entire sequence was a market maker buy model framed using internal to external liquidity on the 4-hour chart, then a lower timeframe buy model for entry.
On the 5-minute NQ chart, an opening range was traded. After taking external liquidity, price returned to internal (FVG) and then to external again, showing the pattern works on any timeframe.
The relationship between internal and external range liquidity provides a consistent framework for understanding price action across all timeframes. By identifying this cycle, traders can establish a directional bias and find precise entries using lower timeframe structure.
What is internal range liquidity?
A fair value gap (FVG).
00:39
What is external range liquidity?
A swing high or swing low (buy side or sell side liquidity).
00:39
What does price do after taking external range liquidity?
It seeks internal range liquidity (a fair value gap).
00:53
What does price do after reaching internal range liquidity?
It reaches for external range liquidity (an old high or old low).
01:05
On which timeframes can the internal-external liquidity relationship be used?
Any timeframe, from weekly to 5-minute.
10:08
In the gold example, what was the directional bias based on the 60-minute chart?
Short, because price was respecting a FVG and targeting an old low (external liquidity).
04:18
What is a 'change of state of delivery' or 'shift structure'?
When price breaks above a previous high (in a downtrend), signaling a potential shift from a sell model to a buy model.
07:20
How did the trader confirm an entry in the gold trade?
By dropping to the 1-minute chart and identifying an order block entry after a liquidity sweep.
05:23
Definitions of Liquidity Types
Clear distinction between internal (FVG) and external (swing point) liquidity forms the foundation of the strategy.
00:39Core Relationship Statement
This two-step cycle (external → internal → external) is the key pattern that repeats across all timeframes.
01:05Bias Inversion After External Take
After external liquidity is taken, failure to continue can invert bias—a valuable insight for trend changes.
03:27Top-Down Approach
Using higher timeframe internal-external relationship to set bias, then drilling down to lower timeframes for entries is a practical workflow.
04:05Model Review
Summarizes how multiple timeframes align: 4H external to internal set sell model, then shifted to buy model after structure break.
09:40[00:11] going to be over the relationship between internal and external range liquidity we'll first hop into the PDF before hopping into trading view for some examples now before we begin I just want to give a shout out to the MMX m
[00:24] Trader for his teachings if you want to find his YouTube or Twitter I will link first thing we are going to do is Define internal and external range liquidity internal range liquidity is just a fair value Gap external range liquidity is a
[00:39] swing high or a swing low in the form of buy side or sells side liquidity so putting those two together what is the relationship between them now the market only does two things it either reaches for old highs or old lows or seeks to
[00:53] rebalance a fair value Gap so understanding this how do they work together well after taking external range liquidity price will seek internal range liquidity after reaching internal range liquidity price will reach for an
[01:05] old high or old low or external range liquidity so after reaching this external liquidity here where can we anticipate price reaching for this fair value Gap in here now after price reaches into this fair value Gap here
[01:18] where can we anticipate it to go external range liquidity so down here so you can see price moves from external range liquidity to internal range liquidity back to external range liquidity so let's hop into the charts
[01:31] and go over some examples of this here we are on the S&P futures weekly chart for our first example you can see we failed to displace below this old low or a swing low right here now if we are going to retrace where can we likely see
[01:44] price reaching for this fair value Gap here or moving from external to internal so let's see what happens so here we reach into internal
[01:56] from here if we're going to respect this fair value Gap where we likely to reach fair value Gap where we likely to reach for external liquidity if we aren't going to respect this then we reach for this old
[02:14] external now we don't have internal yet we don't have a fair value Gap formed so let's see what happens on this next candle so now we do have internal liquidity in the form of a fair value cap so now I'd like to see price draw
[02:30] cap so now I'd like to see price draw back into this area video we failed to displace below the previous bar and close back in So then
[02:43] I'd be looking for the next candle to reach higher so now we reach into the internal liquidity if we continue to respect this
[02:55] and we're going to go lower where we likely to reach for external liquidity now we reach this external liquidity do we have a fair value Gap no not
[03:09] we have a fair value Gap no not yet okay now we do have a fair value Gap and if we zoom out a little we just took this low over here so let's see what happens we could move from external to
[03:27] inversion so then my bias is up and so I'd like to so then my bias is up and so I'd like to see up to this old high and I'd ideally like to see a retracement down before reaching for
[03:40] that you can see we do not get a retracement now it's not always going to be perfect as you notice here as we do not get a retracement and we just continue higher but understanding the relationship between internal and
[03:52] external liquidity can provide a great way to find a bias or a narrative for example this is a weekly chart and so understand the relationship between internal and external liquidity on a weekly chart can give you directional
[04:05] bias for that whole entire week so let's hop into some top down examples and how to utilize this on the higher time frames and then finding an entry for our first top down example here we are going to be taking a look at gold on the
[04:18] 60-minute chart so if you notice here we have a fair value gap which price is currently respecting and if we're going to continue lower where is Price likely to reach for this old low or moving from internal range liquidity to external
[04:31] range liquidity on the hourly chart so with this providing our bias we will drop down to the lower time frames in this case the 5 minute and the 1 minute to look for short setups to this old low so here we are on the 5 minute chart you
[04:43] can see we have this fair value Gap that we R into and we're looking for short setups to this old low we will wait for the start of my
[04:57] session so I will be looking for short setups so here price displaces down and I could be looking to enter this fair value Gap here however if I'm looking for a confirmation entry I will look for a
[05:10] high to be put in in this fair value Gap price to respect it and then go down to a lower time frame so here you can see we respect this fair value Gap so I will drop down to the one minute chart so here we are
[05:23] on the 1 minute chart you can see we put in a high in the 5 minute fair value Gap here and then displaced lower looking at the last up close candle here when price took this liquidity my eyes are on this order block entry right here so I would
[05:36] be looking for a short setup here my stop on this high and then I would be targeting those lows from the hourly chart so let's see how this plays
[05:55] see how we used internal range liquidity to external range liquidity on the hourly chart for our bias we then used the 5 minute chart to find an intermediate term high and then used the one minute chart for an entry so here we
[06:07] are on GBP JPY and if you notice we have an old high that was just taken here now if we are going to move from external range liquidity where is our internal range liquidity right here we have a fair value Gap now thinking ahead a
[06:23] little if we reach into internal range liquidity and continue the trend up where is our new external range liquidity right here so we'll go ahead and Mark that out as well so let's drop down to the 4our chart and see what
[06:36] happens so here we are on the 4our chart you can see this old high that we have taken out I've marked out our new external range liquidity and then we have internal range liquidity on the weekly time frame here now if you notice
[06:48] these are old lows on the 4our but that is what forms the fair value gap on the weekly so you can see we got below this old high with displacement we are currently retracing into a fair value Gap so I'd like to see price go lower
[07:03] Gap so I'd like to see price go lower and run these we get a retracement into a fair value Gap so I'd want to see another leg down and there we go price reaches into internal range liquidity now if we're
[07:20] going to go from internal to external where do our eyes go up to external range liquidity up here so going from a cell model to a buy model so what I want to look for first is when price changes the state of delivery or shift structure
[07:36] which would be over this high so you can see we changed the state of delivery so now my eyes are looking up here and I will eye entries in this up here and I will eye entries in this price leg up to this old
[07:48] high now if I was looking for a swing position I'd want to see if price was going to retest here to get long and Target this old
[08:00] leave me as price just respected a new fair value Gap here and is continuing higher so let's see if we can find an entry so we just have a new fair value
[08:13] Gap here and let's go ahead and zoom in so if you notice we now have a fair value Gap here on the 4H hour so this is internal range liquidity on the 4our so if I'm looking for external range
[08:26] liquidity on the 4our I will be looking for here so now that price enters internal range liquidity I can anticipate it to move where external range liquidity so let's drop down to a lower time frame to look
[08:39] at this move right here and then see if it reaches for this hold high so dropping down to the 15-minute chart you can see we are consolidating right on that fair value get here we get a sweep below and then
[08:55] would be looking for this order block entry right right here my stop on this low which was swept and then looking for a Target on this external range liquidity on the 4 Hour if I want to leave Runners to this
[09:09] old high or the weekly external range liquidity so let's Zoom back in and see liquidity so let's Zoom back in and see what we get an aggressive move higher that Target is hit so let's see
[09:25] if price reaches for this old high on the weekly chart the 4our Chart you can see how this was a market maker buy model within this
[09:40] larger time frame Market maker buy model and both of these were framed using and both of these were framed using internal to external range liquidity so review we went from external range liquidity to internal range liquidity
[09:54] and then from internal range liquidity to external range liquidity from there we used the 4our chart and you can see how we went from a sell model to a buy model then we used the 4H hour internal to external to frame a lower time frame
[10:08] Market maker buy model so the last thing I want to talk about is this can be used on any time frame so for example here we are on NQ on the 5 minute chart and open just created this range here so let's see what happens when one side gets
[10:23] taken so you can see here we get an aggressive move out and then back into the range if we're going to retre TR we will go from external to where internal let's see so here we went from internal now if
[10:38] we're going to continue higher where should we go external now that we took external where can we anticipate price to move to
[10:57] hangs out here if price is is going to continue up although it's not as clean continue up although it's not as clean want to see it make a new
[11:10] so we've taken external there are no fair value gaps here but where do we have a fair value Gap right here so that would be internal so now that we've wretch into internal respected it we're can we reach
[11:25] external so now that we've reached external we don't have any Fair value gaps see what happens okay we've just taken external once again let's see if we create a fair value Gap we
[11:41] do so now we have internal so price is going to go from external to internal then where would it want to go external again so there we go internal to external and I hope you can see how this
[11:56] insightful if you did please consider liking and subscribing if you have any questions feel free to leave them in the comments below and I'll see you guys comments below and I'll see you guys next
⚡ Saved you 0h 12m reading this? Transcribe any YouTube video for free — no signup needed.