
Stop Overcomplicating Trading
44sChallenges the common belief that trading must be complex, offering a simple solution that resonates with struggling traders.
▶ Play Clip"The title promises a full course on smart money concepts, and the video delivers a comprehensive guide with three core lessons and a live trade example."
This video provides a comprehensive guide to Smart Money Concepts (SMC) in trading, focusing on three core lessons: liquidity, supply and demand, and market structure. The instructor emphasizes simplicity and understanding market manipulation by institutions to achieve consistent profitability.
The video promises to break down the ultimate smart money concepts guide, covering liquidity, supply and demand, and market structure, and then piece them together into a step-by-step trading strategy with a live trade example.
The instructor follows the KISS principle, arguing that simplicity is key to profitable trading. Most traders overcomplicate strategies, but the truth is that building a trading strategy is easy; the hard part is execution and psychology.
Liquidity is defined as the fuel that institutions need to enter and exit large positions without moving the market too much. The market is engineered to grab liquidity from retail traders, often by spiking into stop-loss zones.
Old highs and lows are key liquidity areas because traders place stop-losses, entries, and take-profits there. Breakout traders also add liquidity when price breaks these levels.
Many SMC traders fail because they use pattern recognition instead of understanding context. The instructor emphasizes that knowing why price moves is more important than spotting patterns like order blocks or equal highs.
Session highs and lows (Asia, London, New York) contain massive liquidity. The instructor shows how these levels combine with resistance and support to create high-probability zones.
Order blocks are the last candles before a significant move, where institutions place large orders. Fair value gaps (FVGs) are imbalances created by aggressive price moves. Together, they indicate smart money presence.
Institutions partition large orders into smaller fragments and absorb sell-side liquidity during ranges. They manipulate price to induce sellers, then absorb those orders before launching the real move.
Market structure tells the direction of the war. Uptrends have higher highs and higher lows; downtrends have lower highs and lower lows. Structure confirms whether to be aggressive or wait.
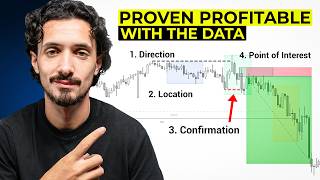
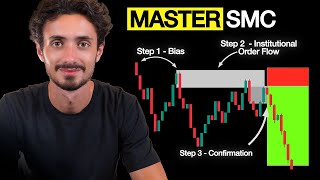
The strategy involves: 1) Identify directional bias (bullish/bearish), 2) Map liquidity points, 3) Wait for key liquidations against your bias, 4) Look for displacement and fair value gaps for entry, 5) Set stop-loss at invalidation point, 6) Target liquidity on the other side.
The instructor walks through a live trade, showing how to manage risk by moving stop-loss to break even, taking partial profits, and not deviating from the plan. The trade ended with a break-even on half the position due to FOMC news.
The video concludes that trading is not about perfection but about consistent application of a simple strategy, managing risk, and maintaining discipline. The instructor offers a mentorship program for deeper learning.
What is the KISS principle in trading?
Keep It Stupid Simple – simplicity is key to profitable trading.
01:02
What is liquidity in the context of smart money concepts?
Liquidity is the fuel that institutions need to enter and exit large positions without moving the market too much.
03:25
Why do institutions need counterparty interest?
To move large positions without significantly affecting the price, they need other traders on the opposite side of their trade.
03:42
What are the three most common areas of liquidity mentioned?
Old highs and lows, support and resistance levels, and trend lines.
04:57
What is an order block?
The last candle before a significant move where institutions place large orders, often disguised as consolidation.
16:44
What is a fair value gap (FVG)?
An imbalance created when price moves so aggressively that it skips over levels of fair value, typically a gap between wicks of candle one and three.
17:12
How do institutions accumulate large positions without moving price?
They partition orders into small fragments and absorb sell-side liquidity during ranges.
19:32
What is market structure?
The narrative of price based on swing highs and lows; uptrends have higher highs and higher lows, downtrends have lower highs and lower lows.
30:29
What is the first step of the trading strategy presented?
Identify directional bias – determine if the market is bullish or bearish.
35:52
Where should a stop-loss be placed according to the strategy?
At an invalidation point, such as below the recent swing low for a long trade.
39:23
What is the purpose of moving stop-loss to break even?
To remove risk when a logical shift in structure occurs, protecting profits while allowing the trade to run.
41:12
KISS Principle
Emphasizes that simplicity is the key to profitability, countering the common belief that trading must be complex.
01:02Market is Engineered
Reveals that the market is not random but engineered to grab liquidity from retail traders.
03:25Context Over Patterns
Warns that many SMC traders fail because they rely on pattern recognition instead of understanding the context behind price movements.
08:40Order Blocks as Footprints
Order blocks are evidence of institutional presence, providing high-probability entry zones.
16:44Market Structure as King
Market structure determines the direction of the trend and validates whether a trade setup is worth taking.
30:03[00:03] of second-guessing all of your entries, and tired of searching for something that actually works, then this video is for you. I'll be breaking down the ultimate smart money concepts guide. These are the exact concepts that helped
[00:17] me go from a regular losing trader to a confident, consistently profitable trader who trades hundreds of thousands of dollars. So, here's what you can expect in this video today. I'm going to walk you through three core lessons that
[00:32] are at the heart of mastering smart money concepts. And they are as follows: liquidity, supply and demand, and market structure. And then I'm going to piece it all together into a stepbystep trading strategy and walk you through a
[00:47] live trade example so you can see how it actually works in action. By the end of this video, you're going to be able to look at the markets in a way that you've never seen before. I follow a principle that I call KISS. Keep it stupid simple.
[01:02] And this one idea might be the very thing stopping you from becoming a profitable trader. You see, we're taught that anything powerful must be complex. The best paying jobs in society, doctors, surgeons, lawyers, years of
[01:18] study, difficult exams, highlevel expertise. So, it's natural to believe that trading should be complex. And that's where 99% of traders go wrong. The truth is building a trading strategy is the easy part. And I didn't believe
[01:31] that when I started. I over complicated everything. I thought that more would help me win. But it just made me confused. And I know that you felt that too. You follow these gurus who teach you 57 ways to analyze one chart and
[01:47] then wonder why your mind's fried every time you open Trading View. What actually works is simplicity. And that's what I'm going to be teaching you today. As a profitable trader, your only goal is to understand how smart money move.
[02:01] These three core concepts, liquidity, supply and demand, and market structure, they're not based on retail gimmicks. They're built on first principles. The problem with most retail traders is they focus on effects instead of causes. Take
[02:16] something like a moving average. It shows you what has happened, not what will happen. But the market doesn't reward you for knowing the past. It rewards you for understanding intention. And when you really start to grasp why
[02:28] price moved, not just that it did, everything will change. As a retail trader, your job is not to move the market. You can't. Your job is to read the battle between the big players, the real money, and then align yourself with
[02:42] the side that's going to win. Because when they win, you win. So, let's dive in to lesson number one. It all starts with this one concept, liquidity. Because until you understand what liquidity is and how it's used, you'll
[02:57] always be the one getting stopped out of your trades, not the one who understands what's happening. When I first started trading, I thought the market was fair. I thought it rewarded logic, that good trades won, and that bad trades lost. I
[03:11] was completely wrong. If you've ever felt like the market knows exactly where your stop loss is, you're not crazy. You're just finally starting to see the game for what it truly is. This market isn't random. It's engineered. And at
[03:25] the heart of that engineering is one powerful force, liquidity. Let's strip it back. What is liquidity really? Liquidity is fuel. It's what institutions, the real players, need to enter and exit massive positions without
[03:42] moving the market too much. If you're trying to move $500 million into the market, you can't just hit buy like we do. You need a counterparty interest. In other words, you need other people to be on the wrong side of your trade. And
[03:57] that's where manipulation comes into things. Other traders are so obvious and predictable in their behavior. You have to understand that you're not the target because you're wrong. You're the target because you're needed. Imagine this.
[04:11] Price is pushing up into a key area of resistance. Everyone online is calling for the short. It looks perfect textbook. And then boom, one final spike up. Everyone gets stopped out and the market melts in the original direction.
[04:27] What actually happened? The market grabbed liquidity to fuel the real positions. Once you actually understand this, you can stop trading with the herd. You stop looking at the chart like a retail trader and you start asking the
[04:41] right questions. Where is the liquidity and who needs it? Because the market doesn't move on your signal. It moves on their intention. Let's use this price chart in front of us to understand where the key most common areas of liquidity
[04:57] can be found in the market. Let's start with the simple things. How about old highs and old lows? Very very easy stuff. What you want to be understanding stuff. What you want to be understanding is that everybody, including myself and
[05:11] other traders, they use old highs and old lows as areas to protect their positions and areas to take their profits. It's what most people use to their stop- losses. So, what you can understand is that every old high or old
[05:27] low that you see sticking out of price, you can bet there is a bunch of liquidity at those levels. And why is that? Simply put, to understand liquidity, all it really means is fuel, as we've already covered. So, if you
[05:41] look at a position, liquidity is money in the market. So, every time that you get tagged into a trade, that liquidity flows into the market. Every time that your stop-loss gets hit, that liquidity from closing that position gets flooded
[05:57] into the market. Every time your takerit gets hit, that liquidity of buying or selling that position gets flooded into the market. Those are the points where liquidity enters the market. So, it's not about just every trade you take.
[06:12] where people's entries are. That's not entirely true because you also enter the entirely true because you also enter the market when you take profit or when you take a loss. you're buying or selling in those moments and that liquidity flows
[06:27] into the market. So, think in terms of entries, yes, but also think in terms of stop- losses and take profit levels. Old highs are key areas where many traders,
[06:39] including institutions, place their stop- losses, place their entries, and place their take profits. Think about it for a second. If you're looking at this market right here, the buyers who are trying to buy in these regions are
[06:53] likely to have their stop losses protected at maybe this low or maybe this low, making this a large liquid area. The same as for sellers. When sellers are stepping into the market in this region, they're probably putting
[07:06] their stop losses above this high or this high in here. Again, making these huge areas liquid. And then you have breakout traders, right? The types of traders who are identifying lows and highs like this. And what happens is
[07:20] when price trades through this level, they execute sell positions in this is going to continue going lower. So they execute their sell positions when price breaks through this level. That is also liquidity. And when they're selling
[07:34] they're putting their stop losses? They're probably putting them above some highs like this. And then the same for the buyers, right? When you have breakout traders who are looking at this high here to be an area of resistance
[07:47] that if traded out of, they will use as a confirmation to go long. Well, they're where do you think they're placing their below this low, below this low, or below
[08:00] this low. And this is happening on all time frames at all times. So highs and time frames at all times. So highs and lows are key liquidity areas, especially when you start to understand context. It's one thing to understand that a high
[08:14] and a low is liquidity. It's another thing to understand what liquidity is going to be there. Who is looking at that level and whose liquidity is available, entries and exits. When you could start understanding who's there
[08:27] and what they're looking at, that will take you to another level. Many traders with smart money concepts make the mistake of just spotting patterns. They're taking the same retail thinking of trying to find head and shoulders
[08:40] patterns or trend lines and applying it to smart money concepts, order blocks, equal highs. They're using the same idea as pattern recognition. That's why most as pattern recognition. That's why most SMC traders also fail. The reason is
[08:53] because they are using pattern recognition. What we use is context. We understand why this is happening. It's a huge difference. So now we understand highs and lows are extremely liquid in this market. We can also go into
[09:09] something a little bit deeper. How about other types of entries? Let's look example at support and resistance. So what we can see here on the same chart, the same price action are different types of mines. Look at this level here
[09:24] for example. This area here you can see we trade through it, we come in, we test that level, we trade out of it, we come back, we test it again, we start trading out of it. So at this area right now, this is a key area of resistance, right?
[09:38] We have this high comes across this high comes across this high. Traders are looking at this as an area that price isn't willing to trade above. Therefore, that's a sell signal for them. So, we understand there are perspectives in
[09:51] this market that are looking at this area as a perfect opportunity to sell. Maybe they're getting ready to get in sales. What that simply means is we understand that this area here is highly liquid from sellers. So, where are they
[10:05] likely to put their takerits and where are they likely to put their stop putting their stop losses up here and maybe they have their take profits down at this low or maybe down at these lows in here. On the other hand, you actually
[10:18] have the buyers who are seeing that this is actually an area of support. You can see that we come into this level, we trade out of it with a large wick. The body closes up in here. We come back to this same area in here and we respect
[10:32] out, we come in, and now we're back in here. And looks like we're getting a little bit of a bullish reaction. There is probably also going to be a lot of buyers who are sitting at these regions. And where do you think they are looking
[10:46] to place their stop loss? Probably under a low like this. Where are they going to be looking to take their profits? Probably at the highs here or above here or maybe even above here. So there's another lens of understanding large
[11:00] clusters of behavior. The thing is is there aren't that many strategies to trade. There's support and resistance, trend lines, equal highs, candlestick patterns, and obviously some indicators. And indicators will also be displaying
[11:15] people that will be looking at their EMAs or their RSIs and still be seeing the same things as these support and resistance type of traders. So, what we want to be understanding is the context around the market that we see. This is
[11:29] essentially knowing what's going on, knowing where everybody's positioned. We this point, we're only at liquidity. We've got two more layers to go. The final piece of liquidity that's obviously available here is the trend
[11:44] line liquidity that is forming across these highs. Right? Very obvious to see. We have a high, another high, another high, another high, another high that are progressively getting lower with each respect of this trend line. More
[11:58] traders flock to get involved in this move. Then what happens? Well, as price that sellers are going to be getting involved. So there's a huge pocket of liquidity here. We have equal highs. We have an area of resistance. We have
[12:14] trend line traders that are all looking to short the market in this level. On top of that, we also have the buyers who are going to be looking at this level as a potential profit target. Now, let's go one step deeper. Let me show you another
[12:28] form of liquidity. And in my opinion, one of my favorite forms of liquidity. If you've been following me for some while now, you know how often I use session liquidity. Very important for me. So days, weeks, and sessions highs
[12:43] and lows have massive amounts of liquidity in them. So what we can see liquidity in them. So what we can see here to be very brief with you is in the blue box we have Asia session. In the green box we have London session and in
[12:56] yellow we have New York session. This isn't the entire London, isn't the main windows that I like to trade. Sometimes I would take a trade a little bit later than this specific session. For example, this closes at 10:00 a.m.
[13:10] Eastern Standard Time, but we understand that New York session still has a lunch session and a PM session that can still be traded. But I'm always looking at these specific levels. So, what you can see here is not only do we have this as
[13:22] an area of resistance, right? This overall area here is not only an area of overall area here is not only an area of resistance, it is also an area of session highs. We have London high from today and we have the highest point of
[13:36] New York session from yesterday. So many sellers that were getting involved in were getting involved in and this is likely now where their stop losses are going to be. Then also on the high here we have a London high. Here we have a
[13:52] New York high and then all the way up here we have another New York high. So we have a bunch of session highs. We also have a bunch of daily highs, right? Highs of day. So we have a the high of Monday here. We have the high of Tuesday
[14:04] currently being formed in this region as well. So a lot of liquidity just in understanding this one simple price chart which if you were to look at this before you may not have even seen these levels of liquidity or may not even
[14:17] understood how to think like smart money because by understanding all the different styles of trading and then understanding what they are likely to be looking at in the market you're able to see where everyone's at. And that's the
[14:33] biggest edge that smart money have. They also understand that most traders often act obviously and repeatedly with the same behaviors and therefore they understand where the liquidity is. Now, why is this important? Well, smart
[14:48] money, like I already said, if they want to trade a $500 million position to go to trade a $500 million position to go long, they are going to need a lot of sellers. And sometimes to get those sellers, if they aren't already
[15:00] available, they will manipulate price and they may push price into an area where that they know there's going to be a lot of sell liquidity, either taking profits and selling a position off, inducing sellers into the market or
[15:14] hitting some form of stop- losses. Depending on the context, all of these events can provide sellers liquidity into the market, which then smart money can gobble up all of that sell liquidity and match it with their buy liquidity.
[15:26] Why do they want someone else to take the other side? Why not just push the question. Let me ask you a question. If you were trying to long the market from here, would you prefer to get all of your position filled at this price point
[15:39] or would you prefer to get 10% filled here, 10% filled here, 10% here, 10% here, 10% here, 10% here, and so on. So your average buyin price is all the way
[15:51] up here. So this is where you wanted to long and by the time you get your full position in the market, this is where you actually averaged your entire order. That is a huge spread difference. And you see institutions, they don't want to
[16:03] take that spread. So what they do is they will use other people's liquidity. And when there isn't any, they will create it. Now that you have a good understanding of liquidity, the fuel behind every move, we need to look at
[16:16] where those moves begin. This is lesson number two, supply and demand. And we're going deeper than retail concepts. We're going into the actual footprints left behind by smart money. I'm talking about order blocks and fair value gaps. You
[16:31] hear these terms all the time, but what do they actually mean and how do you actually use them? An order block is the last point of accumulation or significant move. It's where
[16:44] institutions place large orders, often disguised as consolidation or indecision, right before launching price in a direction. These zones show up typically as the last bullish candle before a heavy drop or the last bearish
[16:59] candle before a heavy rally. And they're powerful because price often comes back to these zones to rebalance or reaccumulate. Now, right next to any good order block, you'll often notice something called a fair value gap or
[17:12] FVG. This is the imbalance created when price moves so aggressively that it skips over levels of fair value. In simple terms, it's a gap between wicks, usually between candle one and candle three, where candle 2's body
[17:28] aggressively displaces price. Something you have to understand is that the market's primary objective is fair value. The more accepted a price level is, the more liquidity that is traded in that level and therefore the more money
[17:41] that a market maker makes. So when price creates imbalances, fair value gaps, the market has a tendency to fill them in certain conditions. And here's the beautiful part. Order blocks show us where smart money is positioned. Fair
[17:55] value gaps confirm their presence. One is the base of the move and the other is the trail. When price breaks structure and leaves behind both an order block and fair value gap, that's your high probability level. This is where you
[18:09] want to be looking for trades in the space between cause and effect. between intent and reaction. The problem with most traders is that they chase price or wait for indicators to tell them what's already happened. But smart money leaves
[18:23] clues in real time. If you know how to read those clues, you don't need a thousand tools. You just need a clean chart, a sharp eye, and an understanding of intent, imbalance, and supply and demand. Think of it this way. When a
[18:37] whale makes a splash, you don't always see the whale, but you do see the ripples that it leaves behind. Order blocks and fair value gaps are the ripples. They're evidence of a presence. And in trading, that's more valuable
[18:50] than prediction. Let's take a look at this same price action to understand here supply and demand. First, let me kind of explain something to you theoretically. Imagine now, for example, you have a bullish market. Market is
[19:03] bullish. price comes down into this level and then it begins ranging, right? So, what happens in this range is it provides the perfect opportunity for a smart money entity to get involved in price. Like I said before, if you want
[19:18] to buy $500 million worth of Euro dollar, you can't just buy because it you'll get in your average order somewhere in here. That's less than optimal. So, these institutions have strategies and one of them is
[19:32] partitioning their positions. So they spread them out. Imagine taking $500 million and then spreading it down into very small receivable orders. Maybe they're little $5 million fragments, right? And a hundred of them, for
[19:45] example. Well, now what you can do is when you see the opportunity where price is happening here is a battle between buyers and sellers. This is what we call fair market value. This is an area of price where both buyers and sellers are
[19:58] clearly agreeing on price. And there's a lot of trading volume in this level and yet the price isn't going higher and it isn't going lower. That's the perfect area for smart money to get involved. And here's what they're then able to do
[20:11] when the market is ranging like this, all of these sellers, right, that are trying to push price lower, their liquidity comes in and then this person in, when this sellside liquidity comes in, they absorb it. They match it. So
[20:27] you know, imagine $20 million worth of sellers coming to the market. This one institution can sit there and gobble up all those $20 million worth of sell because every buyer needs a seller. And then they filled 20 million of their
[20:39] position. And then what happens is those sellers that sold there, they become exhausted. So the buyers begin to take back control of the market and then sellers step back in again. A new batch of sellers, maybe the same sellers, they
[20:51] go again trying to take out these lows. It's a battle. Maybe another $20 million comes back into the market and that same institution is there absorbing all of those orders. So now they've got $40 million without having to move the
[21:04] market. And then what happens is once all of those orders have been taken, they've been absorbed, there's no more sellers. So the sellers become exhausted and then buyers step back in and maybe sellers go again. And this is why you
[21:16] because the market isn't going in any direction. And the likelihood is is that price lower and there's an institution, an entity somewhere who's just absorbing those orders to get involved in the real move. They're positioning themselves
[21:31] because they have a bias of some nature that price will eventually trade higher. And so they absorb all of those orders. And then what happens is at some point in time when it's clear to see the sellers are becoming completely
[21:44] exhausted. Nobody wants to attack the lows anymore. That is where smart money will essentially enable the market to go and it will stop trying to position all of its buy orders in there. Or maybe it will position some of its buy orders in
[21:57] here so that the sellers become absorbed. Nobody looks at the market now and believes that they should be selling and at the same time the market flips its sentiment and all the buyers come rushing to price and everybody now is
[22:10] extremely bullish on the market sentiment. And so what happens is nobody's selling but a lot of people start buying and so obviously price goes higher. That's why sometimes it can take, you know, $50 million to do a 100
[22:23] take, you know, $50 million to do a 100 pip move and $500 million to do a five pip move. The reason isn't that more money equals more distance. No, it's imbalance. How much more buyers are there than sellers? How many more buy
[22:36] orders are there than sell orders? That's what moves price, not how many are traded. Supply and demand. The more buyers, the less sellers, the higher price. The more sellers, the less buyers, the lower price goes. And so
[22:48] get an aggressive move like this and you think that some huge institution is moving the price. Some context that may be true. It could also be that there's nobody willing to sell, right? And that's what they do. They will absorb in
[23:02] these areas and this is where you see them positioning. And then after this positioning, that is ultimately when you see them move. Another example of this, what they'll do a lot of the time, the same scenario. They're trying to absorb
[23:14] example, there isn't enough sell orders coming into the market. Well, what they can do is they will just remove their buying for a moment, allow sellers to push price down or even push price down
[23:26] themselves into an area like this that will make the rest of the market start being aggressively bearish looking for lower prices, which does what? Floods the market with sellers and then it absorbs all of those sellers when they
[23:39] come into here and then they go. And so if you have a retail trader or you've traded support and resistance before or equal highs and equal lows and you've seen these moves where there's an area of support here and you're buying in
[23:52] and for some reason the price just trades directly into your stop loss and then rockets in the opposite direction and you're left there just feeling like you've been abused by smart money. You're not all that wrong. It was
[24:06] intentional designed to take liquidity. Now, is there someone there sitting and understanding that Joe's got his stop loss there? No. It's just common sense. If I understand it, I'm sure the smartest minds in the world know exactly
[24:19] sometimes you see these ranges, manipulation, and then expansion, right? looking for. That's the key point that we want to be identifying. So, let's here. And let's kind of come out of this and kind of we'll go back into price
[24:36] where price is. price was aggressively overbought and then what happens? Price comes into a range. A range can be identified when price is just sitting stagnant in one area of price. This is where you can see the loadup phase. This
[24:51] is where it's perfect for whoever wants to sell the market short in here, right? Whoever's selling price short is able to when all of the buyers because the coming in and they're trying to take price higher. Well, these sellers just
[25:05] absorb those orders. Absorb them. Absorb them. absorb them until there's no more in the market and then price goes down. But what we want to identify is these ranges that occur just before the aggressive move that comes down. You can
[25:19] see that we have one big bearish candle. That's our sign. When you see a range and then a very aggressive sell move in here, that's your sign that smart money order block and every fair value gap is going to work. That's a huge thing you
[25:34] need to understand. So many traders just try random order blocks or random fair value gaps. The key is context. That's why we're going to put in everything we learn into a strategy because this information alone is useless. I can sit
[25:48] here and give you this all day long and you will still need me because you will still need to understand how it all works together. It's like a big machine. It doesn't matter if you have one part of the puzzle or two parts. It doesn't
[26:01] matter if you have nine out of 10 parts. If you don't have it all and then you don't know how to assemble it in the right way, it's useless to you. And so if you're someone right now who you feel like you've got a lot of these tools,
[26:13] understand fair value gaps, you understand liquidity, you've got a good idea of a lot of it, but you're just missing on how to put it all together or it just doesn't seem to work for you. I believe I can help you. Essentially,
[26:26] what I have is a mentorship program. I teach people not only this, but way deeper than this. and not only the individual details, but putting going to be sharing with you a trading strategy, but this is just one of the
[26:39] trading strategies that I have. So, if you're interested in taking your trading to the next level, and you think that you just actually want the handson help out. I have one student, Ralph, who just made $50,000 in the last couple of
[26:53] months on FTMO verified with the QR. You can check it yourself. And he's been with me for 6 months because I'm handson with my clients. We have mentors inside of the program who are hands-on with our clients as well and we get results. So,
[27:07] and you're serious about becoming a profitable trader, then below this book a call with one of our team members and we can understand where you are and you. But let's get back to the video. So, this is the range and this final buy
[27:21] move in here right before the aggressive sell. That's our order block. And the fair value gap is simple. We have one bullish candle, another bearish candle, another bearish candle. So the low of this candle right here and the high of
[27:37] this candle right here, that is our fair value gap. So we have a fair value gap and we have an order block. That is what it looks like in real time. But value gap or an order block alone isn't going to do anything for you. You need
[27:49] into that point. But for now, let's just go step by step. So there would be an an how you do this, whether you use this candle, whether you use the the entire have frameworks for that, but I won't go into the specifics here. I don't want to
[28:05] overconfuse you. It can be stupidly simple. If we just play price out, price comes into this level and then the likelihood is is this level is going to now act as an area of resistance. If it's contextual, just because you have
[28:17] order blocks does not mean they will always work. Please, please, please here. We have a range. Price is aggressive and then it goes one candle, two candle, three candles into this range phase. Look what happens just
[28:30] before the expansive bullish move here. We also get aggressive bearish candle that breaks down below these two lows like this. And then we have the expansive candle. This is again another perfect order block, right? And also has
[28:42] a fair value gap. The high of one and the low of three, they don't meet each other. So that would be a fair value gap in here like this. There's another perfect example of an order block and a fair value gap in motion. You get the
[28:54] expansion, price comes back, respects it, and then continues, right? Again, understand them. You have to understand how to use them. And like I said, that's what we will be getting into. So, let's play price out. What do we have again
[29:07] here? As price comes into this level, what happens? Price stops. We start ranging. We get into this lower range phase. We have an aggressive buy here, which does what? above these equal highs which induces buyers so that what? So
[29:20] that smart money the ones who are in control of price as of right now they a lower time frame when price is running aggressively buyers are flooding to the market they can absorb that liquidity and then use it and then that there also
[29:34] becomes another area of supply and we can see the fair value gap is the first candle the first and the third have a gap in between them that's a fair value gap right same thing again so that's again another example of a bearish order
[29:48] this respects it and then begins trading lower. And so lesson number three, we come to the king of context, the missing key that most traders never truly understand, and that is market
[30:03] structure. And honestly, it molds everything together. You can understand liquidity. You can mark out beautiful order blocks and fair value gaps, but if you don't understand the direction of the war, you'll win a few bowels, but
[30:16] you'll always lose your account. Market structure is how you read the narrative of price. It's how you know whether smart money is accumulating or distributing, expanding, or contracting. It tells you what phase the market is
[30:29] in. So you know exactly when to be aggressive, when to wait, and when to get out. At its core, market structure is built on one simple idea. Price moves in swings, highs and lows. An uptrend creates higher highs and higher lows. A
[30:45] downtrend creates lower highs and lower lows. A breaker structure confirms a continuation. A change of character hints at a reversal. These are your breadcrumbs. They show you how smart money is shifting gears. Let's say
[30:59] you've identified your liquidity above some equal highs. You see an order That's all great, but here's the thing. If the structure isn't aligned, then the trade isn't valid. structure is what tells you whether or not you should be
[31:13] entering this trade. It's your confirmation that smart money is moving in that direction and now you can move in that direction at the right time with direction and your liquidity in your order blocks is like your areas of where
[31:29] you should execute and when you should execute. Most traders are blind to this. They're caught up in single candles, indicators, and signals. But price is telling you a story every day. And when you understand the structure of that
[31:42] story, you can stop reacting and start anticipating. Market structure gives you the when, the where, and the why. And once you have all of that, your strategy finally becomes complete. So, let's dive into this. and then let's take all of
[31:57] what we've just learned and put it into a stepbystep stupidly simple trading strategy that you can take away. So, here we are on the same charts that we've been looking at this entire time. It's time to finally start understanding
[32:11] what the market is really telling us. In this example, actually, market structure is overly simple. If you just zoom out of price like so, what you'll essentially see is a very obvious bullish move. And what we're seeing now
[32:28] is basically the pullback of this price leg. So, what you can see here is an leg. So, what you can see here is an obvious low of price. Here is a swing low, right? We broke an old swing high that came from a macro event and then we
[32:42] So, basically, we're contained within this range. We have a swing high up here and a swing low down here. If we go to a 30 minute time frame, it's exactly the same. Swing high is here. Swing low is here. Swing low becomes here. We break
[32:57] this high. This is our swing high. So our bias, our directional structure is bullish. Now that is again like I said why this is so so important is because you can know it all. But unless you understand which direction smart money
[33:11] is trading in, you're done for. So by understanding that the market is overall extremely bullish now we can apply everything we just learned to understand whether or not we should be looking to sell or looking to buy. So now we can
[33:23] take everything we've understood and we can start mapping out our liquidity. Again you can see here we have the buildup of the highs in here. We have this overall swing high all the way up here that we can use as a target as
[33:36] well. And then we have our internal levels. So we have London high equal highs of New York. We have our area of resistance, right? So, this is going to be a resistance level. A lot of liquidity above here. So, we have
[33:50] another old high in of itself. We have another old high in of itself, right? of these areas are liquidity. And we can map them out just like this. Liquidity,
[34:04] liquidity, liquidity. But we also have our sellside liquidity. We can't underestimate that. We clearly have these equal lows in here that these equal lows in here that essentially act as an area of support.
[34:17] So we have supportbound liquidity as well. So this is liquidity as well. We also have if you can kind of see it clearly an obvious order block in here mitigated. So for the purpose of this
[34:30] what we can begin to understand is our little internal swings. So we go to a 15minut time frame. Now we can understand that again if we zoom out we're looking at the same picture low to high and then price coming down bearish
[34:44] like this and then what happens price comes high low high low high low high low high. So we shift from being internally bearish to internally
[34:57] bullish. So now we have our external bullish, our internal bullish and pretty much we are looking and ready to go long, right? Everything tells us long, market structure tells us to go long. All of this liquidity can be used to be
[35:11] targeted because liquidity can also fuel a move, right? You have to understand that if there are sellside stop- losses in here or breakout buys in here, if smart money wants to buy the market, then once it gets to certain areas, it
[35:26] doesn't want to keep buying price higher. It wants everybody else to do the work for them. And so all of this extra liquidity, all these buyers that step in, they are the ones that push price higher. And with the sellers being
[35:38] scared and exhausted, they stop selling. That's what enables price to go higher. create. So essentially what we want to be doing is waiting. Step one of our strategy. Identify directional bias. When we come to the markets, we want to
[35:52] know are we bullish? Are we bearish? Overall, we are bullish. So our bias is to trade long. We want to trade long with smart money. Then I want to get understand what's likely going to happen
[36:04] tomorrow relative to this overall story. I want to identify all my liquidity points and price. And then I want to wait for key liquidations against me. So I don't want to be the trader who sees everything that looks amazing and then
[36:18] tries to long here and puts my stop losses down here when I understand that level. I don't want to put my stop losses with that level of liquidity because I know the probability the data indicates that price will take that
[36:31] level. So you just need to essentially wait for price. Price starts running higher. We come into these equal lows again, right? price trades straight through those levels once this sellside liquidity has been taken and as long as
[36:45] price is respecting this order block in here or this fair value gap in here as well. Once price is respecting this level, the liquidity has been taken now we can look at expecting higher prices and for confirmation really what we want
[36:59] to look for is a clear displacement. So you can see now that price has got into this level. It's having a reaction. But we want to see a real bullish move that leaves behind a obvious fair value gap that we can then look at trading from.
[37:11] 30 minute time frame. Here's what it looks like. You can see here we have a bearish fair value gap. So I want to see the invalidation. Again another very
[37:23] very important point to understand is that when price wicks a low. So you see price trades below this level and then comes back above that level. That is a
[37:35] clear sign of a reversal. Every time you see a high manipulated with an aggressive wick, the price reverses. You can look at it over and over again, right? You can see here we had some highs. We have a wick of a high. Price
[37:48] then obviously reverses again. Heavy wick on the buy side followed by a reversal. You can look at this time and time and time again. I could show you multiple different variations of where price liquidates a high and then
[38:00] videos as well. When you see this sellside manipulation and a close above would like to see some kind of fair value gap, a displacement of this level. see, this becomes a little bit more of an accumulation phase. Right? We're
[38:16] holding this level. We continue holding this level. We're ranging at this point. Now, what do we have? Now, we have the aggression. So, if the next 30 minute candle maybe leaves a fair value gap of some kind, right, like this, there you
[38:31] go. There's your sign. Our overall direction is bullish. We're in a key area. We've taken the liquidity. Now, the liquidity is up here. So, the price is going to go from one area of liquidity to another area of liquidity.
[38:43] And if you see all of the liquidity is on the other side of the market and you are aligned with that direction structurally, you have an A+ setup. You just need to figure out how to get into that price action. And so what you can
[38:56] see here is very obvious. So we have our accumulation in here. We have our order block in here. We also have our fair value gap. So we want to be looking at entering basically we can look at this range in here. And then we can also look
[39:09] looking at entering in this fair value gap. This is also a inverted fair value previous fair value gap. We just want to be getting ourselves in the market. That's what we care about. Our stop loss is going to go at the low because a stop
[39:23] loss should always be an invalidation point. If price breaks down this low, then the old idea of going long from here is invalidated. And if this low then I don't know where we're going to see price go higher. But currently, this
[39:36] low is what's in control of price. So I'm expecting that this low puts in this a new high. That's essentially a good area that we could look at taking a bit of our partials. One to three risk-to-reward. But overall, if you're
[39:49] think price is heading overall? Price is heading overall toward this high, it's going to clear out all of this liquidity and target this high because that is the structural understanding of price. That is why we understand that this is where
[40:03] we need to trade towards because that there is our understanding of price. That's the structure and that's what essentially gives us the finer details of our target. That's where the market is heading to. It's so clearly obvious.
[40:16] We just needed to figure out how to get in. That's where the small details of the liquidity is and understanding the order blocks because we already to now understand how to get in. And so this is one way to perfectly confirm how
[40:30] market. And so you can set fair value gap cover stops at lows. And really what you want to be targeting is the highs in here because all of this in here is a massive amount of liquidity ready to be rinsed and taken away. So you can see
[40:45] price pulls back again, mitigation of fair value gap. That's perfect reaction. That's exactly what you want to look at seeing into your fair value gap, out from your fair value gap. That's indicative of a solid area to be trading
[40:58] where you can go from there. You want to be looking to get your stop loss at point makes sense, right? For me personally, I'm looking at moving my stop losses to break even when we can logically shift highs. So, that's a good
[41:12] can put my stop loss at break even because I understand that price Now if price is going to return to my level now, it's going to be going through this level because now the new liquidity is at these lows because guess
[41:25] what? Everybody who's missed this move, guess what they want to do? They want to get in later. So now that this is the area of new support and the liquidity exists below these lows, which is what where my stop loss is. Yes, I can also
[41:38] be liquidity. That's why I have to make sure that I'm not there when the liquidity is available. I need to be already out or already moved to break even at the best. And so new liquidity forms here and people are waiting to get
[41:52] in. But there's also the people that are fomoing into the market at this point as trade higher. So you can see price continues to aggressively move higher. We have somewhat of a pullback. This is I won't get into too much detail in this
[42:04] video, but this is where a lot of traders go wrong with psychology, right? coming back and giving them handing them over some of their profits, they look to want to be getting out of the market. New York session opens. You can see we
[42:17] breach this high. Now, we failed to break above this high. So, we've liquidated this high, which at this point is pretty indicative that we may down here. And if we're coming to take
[42:32] this low down here, then price may start to pull back. At this point here, I want to be locking in some partial profits. I want to be closing some of this position just in case price ends up coming all the way back down, right? But not off of
[42:45] an emotion, off of logic, off of understanding how price is delivering itself. We've come into a lot of liquidity on the buy side. This entire move hasn't stretched all the way up to this specific price level in here. So,
[42:58] I'm able to take off three risk-reward at this specific price point just in case price starts coming down towards here. Because if price comes all the way coming back to my break even point. My break even point is inside of this
[43:11] level. So if we kind of just go down to a lower time frame, see how things start playing out. You want to always have eyes on as well because is that low? This low goes down. Okay. So now what we're seeing is price is aggressively
[43:25] some kind of macro event. Let's take a little look. Cool. So, what we can see is we're about to have FOMC at 2 p.m. So, what I
[43:39] want to be cautious of at this moment in time is what happens during this FOMC event. I've already taken my profits, at least half of my position. I still have some profits left over, but at this point in time, I have no risk on the
[43:54] point in time, I have no risk on the table. I'm break even on my position. My uh original stop loss is down here. I only have half the amount of risk on now. So, as price is approaching this level, I want to look at seeing how I
[44:08] can approach this specific price point. I would like to make sure that my stops not trying to be forcing myself into this position. So, there's FOMC and during FOMC, I get taken out of that position
[44:22] at break even. So, half of my position comes off here. The other half comes off with no win, no loss. So, we take half a position, which is fine. It's risk around this area. So, you can see now we're starting to range in this new area
[44:36] of price. Still ranging in this area of price. So, we we haven't taken out this respecting this area. Everything is still on. We still have this hourly fair value gap that's being protected. Price is ranging. Okay, cool.
[44:51] Now, we have some expansion. The thing is is this is an Asia session, so I'm If I want to get back in this move, which could continue trading higher, I want to see what London session has to offer. London session opens with a very,
[45:07] very nice reaction. What does the next candle give us? The next candle gives us a nice fair value gap. We can try and get ourselves into the market inside of our stops? We're going to want to put our stops at a logical low and just
[45:21] continue riding this to the highs in here. So, 1 to 2.35 riskreward. O want to expand this at least a minimum of a 1 to three riskreward. This needs to be at least a 1 to three to make any sense. Continue
[45:35] playing price out. See price continues trading and at that point it no longer makes sense to place that order. And so that position comes off the table and there's the overall target hit. Now was this a perfect trade? No. We didn't
[45:53] capitalize on the whole thing. But that's the reality of trading, right? textbook. There are going to be times where you maybe only get half of your you tag out at break even and then continue trading higher. The thing is
[46:07] and what you don't do is you don't then get emotional and start deviating from your plan, which is what 99% of traders do. So the reality of trading is it isn't perfect. It's about doing what I've just done, managing risk, assessing
[46:20] actually make sense. If you want to be able to do this consistently and do it with me every single day, then check the link down in the description, speak to one of my team members, and we'll see how we can get you to where you want to
⚡ Saved you 0h 46m reading this? Transcribe any YouTube video for free — no signup needed.