

How I Made $100K in a Month Trading
44sClaims of massive monthly profits grab attention and spark curiosity about the secret strategy.
▶ Play Clip"The title promises a strategy that made $100K, and the video delivers a detailed method plus a live $35K trade, but the claim of consistent six-figure monthly income is unverified."
This video reveals a systematic trading strategy that the creator claims has consistently generated six-figure monthly returns. The approach, called the 'fake market shift' entry model, is broken down into three simple steps: identifying trend direction, mapping points of interest (supply/demand zones), and executing entries based on liquidity sweeps. The video includes both theoretical explanations and a live trade example where the creator made $35,000 in 30 minutes.
The creator claims to make $100K per month using a single systematic trading strategy and promises to reveal the method.
Step 1: Identify trend direction (bullish or bearish). Step 2: Determine point of interest (supply/demand zones, order blocks, flip zones). Step 3: Wait for price to reach the zone and look for the 'fake market shift' entry model.
A fake market shift occurs when price briefly breaks structure (e.g., takes out a swing high/low) but then reverses, trapping retail traders. This creates liquidity for smart money to enter in the opposite direction.
Aggressive entry: Enter on the candle that sweeps liquidity (immediate). Conservative entry: Wait for additional confirmation, such as a break of the nearest structural level or a flip zone reaction.
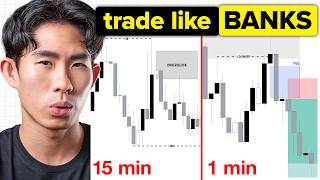
The creator walks through a bullish example on a 15-minute chart, identifying a demand zone, waiting for a fake market shift, and then entering after liquidity sweep. Both aggressive and conservative entries are demonstrated.
The creator executes a sell trade on EUR/USD, waiting for price to sweep liquidity above a swing high, then entering with a sell stop order. The trade hits take profit for a $35,000 gain in 30 minutes.
The creator emphasizes consistency and backtesting. He promotes his '1% Club' for more strategies and ends with 'you're just one trade away.'
The video presents a trading strategy centered on identifying fake market shifts and liquidity sweeps to enter trades with high probability. While the creator claims consistent six-figure monthly profits, the approach requires significant skill in market structure analysis and risk management.
What are the three steps of the SMC strategy presented in the video?
1. Identify trend direction. 2. Determine point of interest (supply/demand zones). 3. Wait for price to reach the zone and look for a fake market shift entry.
00:27
What is a 'fake market shift'?
A fake market shift occurs when price briefly breaks structure (e.g., takes out a swing high/low) but then reverses, trapping retail traders and creating liquidity for smart money.
03:02
What is the difference between aggressive and conservative entry?
Aggressive entry: enter on the candle that sweeps liquidity. Conservative entry: wait for additional confirmation, such as a break of the nearest structural level or a flip zone reaction.
07:21
How does a fake market shift create liquidity for smart money?
Retail traders enter after the fake shift, placing stop losses below the swing low (for buys) or above the swing high (for sells). When price reverses and hits those stops, the stop orders convert into market orders, providing liquidity for smart money to enter.
04:50
What is the recommended way to set an alert for a point of interest?
Set an alert at the edge of the zone (supply/demand zone) so that when price steps into it, you are notified to analyze the chart for an entry model.
02:37
In the live trade example, what was the take profit target?
The take profit was set at the edge of a zone (the next swing high/low area). The creator also mentioned using a fixed 5R risk-reward ratio.
19:32
What timeframe did the creator use for the live trade example?
The creator used a 15-minute timeframe for the overall structure and a 5-minute timeframe for entry refinement.
20:19
Three-Step Strategy Framework
Provides a clear, actionable structure for traders to follow.
00:27Fake Market Shift Concept
Explains a key mechanism of how smart money traps retail traders and builds liquidity.
03:02Aggressive vs Conservative Entry
Offers two distinct entry styles based on risk tolerance, applicable to various trading personalities.
07:21Live $35K Trade Execution
Demonstrates the strategy in real-time with a significant profit, adding credibility to the method.
20:19Consistency Over Perfection
Emphasizes the importance of backtesting and sticking to a single strategy for consistent results.
25:42[00:01] actually like to make 100K a month with just one simple strategy it might sound like a fantasy but for the past two months I've been consistently hitting six figures in my trading account so today I'm pulling back the curtain to
[00:15] show you exactly how I make it happen this is a systematic approach that this is a systematic approach that turned my trading game around so Focus take note because what about to see could change the way that you trade
[00:27] forever so this right here is the holy grow to trading is that one simple entry model oh Brad what are you talking about what is this monstrosity this looks so complicated my five IQ brain can't comprehend this complex Majestic
[00:44] strategy don't worry all right come your tits I'm going to break it down to three simple steps for you so let's take a look at the bullish scenario first the first step is always going to be identifying the trend Direction so that
[00:56] you can get your clear directional Biers whether price is bullish or bearish pulls back and then goes up and break structure right so obviously this is bullish break of structure to the upside price has just broke through this Wick
[01:10] high right here so now after break of structure we're anticipating price to bullish Market structure just like this we are trying to capture this new higher low so that we can trade in continuation with that overall bullish Trend
[01:24] the first step right you want to identify a trend Direction by mapping determine whether price is bullish or bearish and ideally you want to trade in alignment with that overall trend direction right so in this case once you
[01:39] second step is to just determine your point of interest to map out your supply and demand zones or your order block or flip zones whatever point of interest if you don't clearly Define your point of Interest you're going to be taking a
[01:54] bunch of random trades at anywhere when price is in the middle of nowhere and these are all low property setups right so we want to Mark out our point of there's only one demand zone right here right this is the extreme demand Zone
[02:07] but obviously sometimes price is not going to be so straight up like this then create like a minor pullback just like this and in that case there will be a demand Zone here right so you basically want to map out all your point
[02:23] right which could be the 4-Hour time frame for you if you are a swing Trader or it could be like a 15-minute time frame for you if you are a sculle so once you have clearly defined your point of Interest the next step is to just
[02:37] Interest right so I would actually advise you to set an alert at the edge of the zones itself at edge of this demand Zone once price step into it that is where alert goes off I'll go and analyze the charts and look at my entry
[02:50] this is really like the secret on how you can get those sniper precise entries interest that is where you want to look for this entry model itself it's called
[03:02] the fake Market shift entry model so basically doing this pullback phase right here we want to see some form of strong liquidation right what the hell is strong liquidation what are you actually yapping about BR so a strong
[03:15] liquidation occurs when price actually liquidate a strong low or a strong High this pullback just like this we know that price have shift up bearish which means price is creating lower highs lower lows lower highs lower lows right
[03:29] so in a barish scenario just like this all these Highs are strong highs right because it's strong highs that led to price breaking past the weak lows right later on price actually came down here right it came near the point of interest
[03:42] and it actually went up there and take out our Strong high when this actually shift which confirm to us this could potentially be like a shift in structure but in this case this was just a fake Market shift right because what happened
[03:57] is that price actually came up there s the available quility Above This high right here for price to continue going down even further right so this is what we call a fake Market shift because if this Market shift were to do job price
[04:10] highs and higher lows and then this would be that new higher low in this overall swing structure right in this overall bullish Trend Direction okay but that did not happen because the bearish internal structure continue right which
[04:24] even deeper into potentially this when this actually happens right when you get a fake Market shift just like you get a fake Market shift just like this this low becomes a strong low right
[04:37] it's no longer a wick low because this low led to price breaking past that strong high right so making this a strong low which means that it's going to be a lot of available liquidity below the strong low because what happened is
[04:50] going to be entering for a buy like somewhere right around here once they see that market shift they think that oh the pullback is over and right now we're enter for a buy right here and I'm going to place my stop loss below this low
[05:03] like a stupid retail Trader and when that happen this build up available here because you must understand that if they're entering for a buy right here and if they get stopped out the buy orders get converted into sell orders
[05:19] smart money right if you are the big Banks the financial institutions and you want to enter for a large amount of buy orders at this demand Zone but there is no one on the opposing side to fulfill your large am of buy orders
[05:34] because no one have billions of dollars just sitting around the house you need some form of liquidity and where are you going to get the liquidity from you're going to get it from the retail Traders stop losses right because remember if
[05:46] they get stopped out if all these retail buyers get stopped out their buy orders get converted into sell orders which is able to fulfill the smart money's large amount of buy orders boom magic this is exactly why some sometimes smart money
[06:00] will manipulate price cause this fake Market shift just to build up more available liquidity below this low and later on price will come down there and liquidity below this low and then the real move will actually happens to the
[06:15] upside because now they actually have sufficient liquidity to move the market in their favor so this is where you actually want to enter into the trade you want to enter upon strong liquidation right which means upon this
[06:27] fake Market shift during the pullback phase itself okay so just a quick recap that this is the bullish break of structural and now we are anticipating price to pull back and where is Price going to pull back too that is where we
[06:41] see that there's our demand zone right here potentially another demand zone right here and now we want to wait for price to pull back and mitigate either it does we want to look for our entry model which is our fake Market shift
[06:54] entry model itself right so in this case price start pulling back pulling back pulling back and in this case since this is the only demand zone right we are not doing anything until price mitigate that demand Zone once price mitigate the
[07:06] at the pullback phase itself and I want to see whether I got my entry model Liquidation in the form of fake Market shift if there is cool that is where I can start looking for my entry and when I start looking for my entry there's two
[07:21] types of entries that you can actually deploy one is called the aggressive conservative entry once again this depends on your r tolerance and your personality right if you are more conservative you want to play it safe
[07:34] you that you want to like have the most safest route by all means go ahead use the conservative entry if you are more aggressive you want to get in as soon as possible after price uh swep the available liquidity below this low
[07:46] dender this way can use the aggressive entry just take note that if you use the aggressive entry what can potentially happen is that price can continue going strong move to the upside right let me just explain to you what are the
[07:59] differences between these two entry first of all the aggressive entry states that you want to enter upon the Candlestick that swept liquidity right so in this case we know that there is strong available liquidity below this
[08:11] strong low right here right so we want to see price swep that low so once price actually break past this low right here that is going to be a Candlestick right so this is what we call the Candlestick that swep liquidity so you want to wait
[08:24] to close and then you want to place a buy stop order above the Candlestick hopefully when price actually start reverse and go up you get that mid trade just like this okay on the other hand you got your conservative entry which
[08:37] says that you need to wait for extra confirmation before you actually enter for the trade right which means you want to wait for some form of Market shift confirm that's a shift and structure or some form of flip right some form of fit
[08:49] reaction so in this case this is the nearest lower high that led to that wait for this lower high to get broken to confirm to us that you know what the pullback is is over and right now we are moving to the upside okay so in this
[09:02] here that is where you can wait for price to pull back to your lower time shift itself and then that is where you can look for entry as simple as that this is your confirmation entry this is your conservative entry you basically
[09:17] want to identify the nearest structural lower high you want to see that get broken to confirm to you that right now uh the demand has overpowered Supply and back to that demand Zone that led to the Market shift itself and then that is
[09:30] once again you must understand that there's pros and cons to the entry the good thing about the more confirmation right which means you have more confidence but the bad thing
[09:44] is that it might to more M trade opportunities because sometimes what can right swep this low right here and it just goes up without pulling back just like this in that case if you're waiting for an entry model you're waiting for a
[09:57] conservative entry you would have missed your trade setup my advice is simple the conservative entry out and then Based on data that you have gathered through countet of back testing and forward testing find out one that works
[10:10] for you and stick to it consistently because at the end of the day consistent actions lead to consistent results now let's look at a bar scenario right here in this case price goes down pulls back and then goes down create like a minor
[10:23] even further okay so in this case we have identified our Trend Direction actually led to a bearish break of structure when it take out this low price is going to start turning bullish to facilitate that pullback now in this
[10:38] case that is your extreme demand Zone that we have drawn up right here and it right here right at this structural pullback right here so in this case what you want to do is simple you want to set the alert at the edge of the point of
[10:51] Interest right I personally will set an alert right here and right here and then middle of nowhere I'm not going to be doing anything I don't care what price is going to do I only care when price start mitigate my point of Interest okay
[11:04] mitigate first point of interest just like this you want to look for entry model itself right you want to look for any form of fake Market shift in this case do we get any fake Market shift right here no because price just created
[11:16] higher highs higher lows right there is no strong liquidation no Market shift whatsoever it's just the corrective nature of the pullback and then over point of Interest right in that case we know that this point of Interest is no
[11:29] longer relevant to us and that is where we can just neglect it and that is where we want to wait for price to mitigate our next point of Interest which is this again this zone is going to be much more High property because of the fact that
[11:42] it's literally that last line of defense price has to hold in order for price to remain bearish okay so in this case we are still not doing anything until price that we have right here our extreme Supply Zone once it does that is where I
[11:56] will go and look for my entry model I I want to see strong liquidation I want to pullback phase itself right so that is where I look from left to right right is that pull back here yes is there strong liquidation no right because price is
[12:11] and then based on this you can see this is the last higher low right so if you're mapping on your inal structure this is that last higher low and then this is that last high right here so if price take out this last higher low
[12:23] it's going to be a market shift right so in this case price took that out and then it started rever in right so this was obviously a fake Market shift since price did not remain bearish right it continued the the bullish pullback so in
[12:36] that case fake Market shift we know that there is strong available liquidity above this swing high right here because this High has became a strong High since it led to this Market shift so we know that there is available liquidity above
[12:49] the high so now we want to actually enter upon that liquidation upon that strong liquidation of this strong High heeld okay so once price actually swept the liquidity above the Strong high right here we know that there is two
[13:02] either the aggressive entry or the conservative entry right so in this case right so in this case we saw that this is the nearest higher low that led to
[13:14] you want to wait for that low to get taken out so in this case price actually created a fit reaction right here right so when there's a fit reaction we know you've been watching my videos you will know that this is a flip Zone because
[13:27] this is a fil reaction when where it shows that supply has overpowered Demand is where we want to look for our entry right there upon the mitigation of the flip Zone itself now with that said let's go on the charts and look at some
[13:41] quick examples okay so in this case right here we saw that this is a bullish actually created a bullish break of structure to the upside just like this of structure we can identify that this drop here ladies and gents is our swing
[13:56] low right so this is my 15minute strong strong low and then this right here is my 15minute swing high so now that we have identified our 15minute swing range we know that we should only be focusing on this area right here which means
[14:10] what's happening on the left hand side what's happening down here all this monstrosity it's not of our concern so the next step is to map out your point of interest and we saw that this is that demand zone right you can see this is
[14:23] that demand Zone that led to a bullish break of structure right price pull back come down here boom bullish break structure so now we are not doing anything until price B get our point of Interest right so if price is over here
[14:35] it's like dancing around consolidating I don't care I'm setting my alert at this area here and unless price step into this area this is none of my concern all price step into the point of Interest so I'm just chilling you know smoking cigar
[14:51] sipping on a mon whatever and boom price Ste into my point of interest I'm locked in I'm pulling out my charts I'm looking for my entry model itself so at this point of time I want to see some form of strong liquidation right so in this case
[15:03] I'll look at the pullback is there any form of strong liquidation whatsoever so right right I see price goes down create lower high lower low lower high lower Market shift right because it's literally just creating lower high lower
[15:18] low lower high lower low right so in that case we're not doing anything so liquidation to occur price has came deep into my point of Interest okay cool and right here this is that last lower high all right so if that is going to have
[15:33] some form of strong liquidation price need to take out this last lower high right to give us a fake Market shift boom that actually happened right so in this case this is our Market shift right this is our Market
[15:45] shift right here this is where we can potentially wait for price to liquidate this strong low right here and then we can look for our entry all right so now strong low since it leted to price taking out this strong High here and we
[16:00] know that there is a ton of available liquidity being buil up below this low going to be entering for a buy here and placing that stop loss below this low here and we want to see that get liquidated okay so you can see I want to
[16:15] see this low get taken out which means whatever price is doing right here none of your concern right you don't care you do nothing until this get taken out okay so wait wait wait boom that get taken out right here the minute that get taken
[16:28] for entry so if you're looking for the aggressive entry you want to find the Candlestick that swep liquidity right so the Candlestick that take out this low here is this Candlestick itself and if you're looking for the aggressive entry
[16:41] what you will do is that you will place a buy stop order Above This Candlestick itself above the Candlestick that swept liquidity so just like this so hopefully the trade and then Happy Days right you can potentially trade it all the way up
[16:56] here now if you're waiting for the conservative entry you want to find that nearest lower high that led to the liquidation right so based on this we here and then led to the liquidation itself is this the nearest lower high no
[17:10] is this the nearest lower high yes in that case we know that we want to see the price take out this right that is our fror Market shift and then we want form of Zone that led to this Market shift itself and then that is where we
[17:23] means if you're looking for the conservative entry you shouldn't be doing anything until this get taken out right here right so there where I want to see that get taken out boom that gets taken out just like
[17:37] that is where you can start looking for entry okay so for the conservative friends out there once that get taken out jump down to your lower time frame minute for you and then that is where you want to wait for price to pull back
[17:53] to some form of point of interest that led to this market so in this case you right extreme Zone that led to the market shift itself lower time frame market shift but what do we have here as well we got a f reaction right because
[18:08] price went up there mitigate this Supply that we have right here on the left hand side and when they mitigate this Supply it created a Fai reaction right you can see it created a f reaction and then the price came down here creating another F
[18:21] reaction and then goes up right so in this case we know that this a right here this case we know that this a right here is our flip Zone right it's that point of interest that caus the supply to fill and it's that point of interest that
[18:35] confirm to us that demand has overpowered Supply right so based on this you can enter at the extreme Zone itself or you can enter the flip Zone in enter on the edge of the flip zone right because a lot of times price can just
[18:48] after the market shift and then just fly off right and if I want to enter at extreme Zone I might miss my trade opportunity so I enter the edge of the see where we into trade boom there we have it that is
[19:02] where we got T into trade right we are in for our buy position at the moment just like this and you probably placing your stop loss below the flip zone right but in this case because there was a lot of Demand right here right which proved
[19:16] to us that this flip zone is working I will personally just place my stop loss here and I can potentially place my take profit at like this next swing High here or you can even place it at like uh 5r right just to be very simple and
[19:32] mechanical right so in this case you wait for price to hit TP you're not boom price match your TP as simple as that all right just like that you almost enough to place your stop loss a little bit below the bullish candles stick low
[19:48] need to give your stop loss a little bit of breeding room right but what can to play safe you can just place your stop loss below the flip Zone instead of stick as well so once again really up to you by in this case we smash our take
[20:02] have broken down the chart and walked through the entry model in theory it's about to watch next is a live trade recording where I executed this strategy in real time and guess what I made 35k in 30 minutes what that someone's 6
[20:19] month salary right there bro enjoy the video well that was faster than I thought I literally just came back from d and we had just made the 5K okay we literally just got tapped into the trade as you can see right here we place a
[20:33] as you can see right here we place a sell stop order uh below this 15 minute liquidation candle right here right because what happened was that we got a time frame let me just show you what that looks like all right but before
[20:46] on the higher time frame right because if you guys don't understand where price is at right now what's the structural what's the directional bias no point of me showing you where the liquidity is that all right so first of all just look
[21:00] at this we got price pushing down to the downside and then right now price turned right so the internal flow started shifting bullish and where is it pulling back to it's potentially pulling back to this - minute swing high that we have
[21:14] right here right it's a strong high and you can see this is the extreme Supply Zone that once again swept the liquidity above this swing High here as well right so this is the extreme Zone we waited very very patiently for price to come up
[21:27] into the extreme Zone and when he did this is where so many retail Traders they got induced to enter for a sell position early right they enter immediately after price step in uh step into the extreme Supply Zone and then
[21:40] they start placing their stop loss above these highs guess what liquidity and time frame price comes up pulls back goes up again comes down here creating a fake Market shift faking out so many goddamn retail Traders once again to
[21:55] enter for a sell too early right just for price to build up more available liquidity above this strong high now why is this a strong high now because this High led to price breaking past this strong low right here right giving us a
[22:11] fake Market shift and then later on price went up there and liquidate that strong high that we have right here right and it pretty much grabed all the available liquidity above these inducements here and also above this
[22:23] swing High here as well and then tapping into our extreme refined point of interest that we have on the 5 minute time frame I'm telling you the market is
[22:35] arts and my trade is playing out beautifully this is what happens when you understand liquidity and you understand what time to trade right so patiently for all the goddamn liquidity to be swept and then we place like a
[22:50] sell limit order I mean sell stop order after our alert was set off when price mitigated this Supply zone right but the first step is always way to get a clear directional bias on what the market is trying to do where is it right now and
[23:04] step is to identify that high property this is high property Zone because it's swep liquidity is also the extreme Zone last night of Defense very very refined Chef Keys creme the La Creme Zone and
[23:19] yeah just patience right wait for price to mitigate the Zone alert set off ding ding ding and then we just enter after we got that liquidation so a very very
[23:31] see right now it's also the overlap between London and New York right so we the market especially since price has just spped all the goddamn stop losses that we have Overkill all the buy side liquidity right here and by the way our
[23:47] take profit is at this zone right here okay just the edge of this Zone you know what for this trade I'm just going to practice my Detachment by just closing my phone I'm not even going to look at the the p&l at all just going to be
[24:01] the the p&l at all just going to be completely monkik so just get this away from me right just going to be in this Tranquility mode all right just focusing on the raw price action right now and you can see where price is at right now
[24:14] we are probably going to expect a little bit of resistance right because this is indeed that point before liquidation or the block before liquidation right where we got price pushing up demand stepping into the market and causing price to
[24:29] actually sweep the liquidity Above This highs so ideally we want to see this Zone fail right which proved to us that the supply has overpowered demand and the downside now looking back at entry I realized that we could have probably got
[24:43] in at like a much better timing because we got in only after the sell stop was triggered when price actually pierced through the liquidation candle right through the liquidation candle right here right so yeah if you look at a 5
[24:58] minutes time frame we could have entered after price closed below this 5 minute liquidation candle instead of that 15minute liquidation candle right so just by doing that alone my risk throughout would have been prettying
[25:14] crazy yeah yeah pretty damn crazy yeah so you know what we will work on our entry next time get a much more precise entry using this entry model but yeah winning all right guys we're going to set and forget at this trade I'm going
[25:29] at where price is at when I come back from dinner yo what the faster than I thought I literally just came back from denal and we had just made 35k quick
[25:42] won this trade because this trade was was quite simple to be honest pretty much bread and Buttle so yeah there you have it guys quick little 35k on Euro USD this was a quick little 30 minute sculp honestly I'm quite numb to numbers
[25:58] at this point of time it's just another day in my life yes guys I'm still eating chicken breast and broccoli even though I make six figures a month because life is expensive nowadays come to think of it I've been eating chicken breast for
[26:11] it I've been eating chicken breast for like 5 years what the that my friends is how a strategy like this can turn a simple trade into a 35k win in just 30 minutes by the way I wasn't kidding about the chicken breast yeah I enjoy a
[26:26] good medium bre stick here and there but most of the time I'm still out here eating plain old chicken breast because apparently even a woke 22 year old trillionaire trading Guru isn't exempt from the Jim bro diet struggle now the
[26:42] best part is that this is just one of the seven entry model that we have inside the 1% Club so if you ready to dive deeper and take your trading to the next level skill to six figures join us here in the 1% club and unlock all of
[26:56] our proven trading strategies with that said remember you're just one trade away



⚡ Saved you 0h 27m reading this? Transcribe any YouTube video for free — no signup needed.