I Made $500K in a Month Scalping Gold
45sThe massive profit claim immediately grabs attention and sets up high expectations, making viewers want to learn the strategy.
▶ Play Clip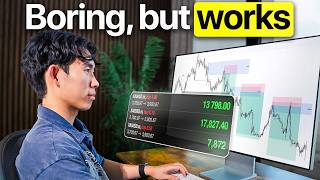
"The title promises a 'most effective' strategy and delivers a solid framework, but the heavy promotion of the paid summit and Edge Flow drags it down."
Brad Gold reveals his personal gold scalping strategy that he claims made over half a million dollars in a single month. He outlines a five-step approach focusing on market structure analysis, premium/discount zones, and strict risk management, emphasizing the importance of trading with the internal order flow and waiting for price to come to your zones.
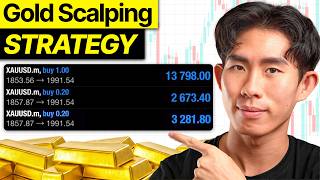
Brad introduces his scalping strategy for gold, claiming it made him over $500k in one month. He shows his trading journal on Edge Flow, highlighting two specific trades: one for $274k and another for over $300k, both taken in June.
Gold is described as incredibly volatile, moving fast in both directions. Brad shares his 2021 experience of trading gold daily for a year, which taught him the nature of gold, including when it moves and how far.
Brad advises beginners to master forex pairs like EUR/USD, AUD/USD, and GBP/USD before trading gold. He compares forex to level 5 and gold to level 20 in a video game, suggesting you need to build skills before facing the 'big boss'.
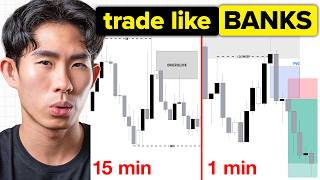
The strategy uses three time frames: 1-hour to determine trend direction and who's in control, 15-minute to find trading locations (zones), and 5-minute for entry signals. He recommends adding these to favorites for quick access.
Brad uses black and gray candlesticks instead of green and red to remove emotional bias. Green/red trigger fight-or-flight instincts, while neutral colors help maintain discipline.
He explains the difference between swing structure (obvious highs/lows) and internal structure (smaller movements within). In a downtrend, price makes lower highs and lower lows; in an uptrend, higher highs and higher lows. He emphasizes identifying the swing structure first.
A valid break of structure requires a candlestick body close beyond a level, not just a wick break. A wick break could be a liquidity sweep. He shows an example where price closed below a low, confirming a valid internal BOS.
Using the Fibonacci retracement tool from swing low to swing high, the 50% level is the equilibrium. Above is premium (expensive, look for sells), below is discount (cheap, look for buys). This helps time entries.
In an uptrend, buy at demand zones (origin of bullish moves with strong momentum). In a downtrend, sell at supply zones (origin of bearish moves). He shows how to draw these zones from the start of strong moves.
Liquidity is where stop losses and stop orders sit, typically above equal highs and below equal lows. Smart money uses this as fuel to manipulate price. He warns, 'If you can't spot the liquidity, then you are the liquidity.'
Brad prioritizes the internal structure over the swing structure for scalping, but acknowledges the swing structure controls macro direction. Ideally, both align. If they contradict, trade the internal structure but respect the swing. If unclear, stay out.
Do not chase price. Wait for price to reach your 15-minute zone. If price smashes through the zone, the setup is invalid. He shares a losing trade (-$84k) to emphasize that even with correct waiting, losses happen.
When price enters the zone, drop to the 5-minute chart. Look for: 1) Liquidity sweep above a swing high (V-shaped reaction), 2) Market shift with a candlestick body close, 3) Retracement to a new 5-minute zone. Enter with at least 2R risk-to-reward.
Brad risks 0.5-1% of capital per trade, has a max daily loss of 2%, max daily profit of 5%, max 3 trades per day, only trades during London session, and avoids news 15 minutes before/after high-impact USD news. These rules are enforced in Edge Flow.
The strategy is a complete system: analyze structure, find zones, wait for price, and execute with strict risk management. Success comes from discipline and following the rules, not from chasing every move.
Gold's Volatility
Explains why scalping is necessary for gold due to its fast, unpredictable moves.
01:31Beginner Advice
Provides a clear progression path from forex to gold, using a video game analogy.
03:08Valid Break of Structure
Clarifies a common mistake: wick breaks are not valid BOS; body closes are required.
11:27Liquidity as Fuel
Highlights the importance of liquidity for smart money manipulation, a key concept for traders.
18:34Waiting for Price
Emphasizes patience and discipline, a critical skill for consistent trading.
25:07[00:02] scalping strategy you'll ever need. It made me over half a million dollars on gold in a single month, and it fixes the reason most traders lose trading this asset. Today I will show you the exact five steps on real trades, and by the
[00:16] control of price, where you're allowed to trade, where your stop loss should go, and when to stay out completely. If you're new to the channel, my name is Brad Gold. I've been trading for seven years and I document every single trade
[00:29] live on my second channel, Brad Trades. I've also helped hundreds of students quite simply put, I don't want your money, I just want you to become a better trader. With that being said,
[00:41] first of all, just to show you that I walk the talk and I practice what I preach, I want to show you what this strategy actually made me. So this is my journal on Edge Flow, which is the trading platform that I've built to help
[00:54] traders become more disciplined, become more profitable. Every single trade that I take on the trading platform automatically gets imported into my trading journal. So this was the trade that I'd taken on June 18 using the
[01:06] exact strategy which I'm about to show you. Once again, for the receipts, you guys can check it out on my second channel. I literally documented the entry and exit, how I managed the trade, my thought process throughout the entire
[01:18] trade, all on there. So go and check it out. Another gold trade I've took is this one which made me 274k in the exact same month itself, on June 30 to be exact. So yeah, like I said, that's over half a million dollars from
[01:31] filmed live so you can go and watch every candle. Now before I show you the entire strategy and how I took the trades that I've shown you guys, you nature of gold. And that is the fact that gold is incredibly volatile. It's
[01:47] move incredibly fast. When it goes up, it goes up fast. When it goes down, it goes down fast. It's just this beast that is so hard to tame. It's very unpredictable. It's like a wild horse where no matter how much you whip it
[02:00] just will not listen to you. So back in like 2021, I traded gold every single day for an entire year, right? Like me and gold were like best friends. And lot of money, I mean I did make some money and I end up losing it, was
[02:14] actually one of the best year ever because it allowed me to learn about the nature of gold. It allowed me to understand what times does gold tend to move and when gold tend to move in that time, how far does it actually move,
[02:27] right? Whether it is 50 points, 100 points. It pretty much allowed me to get to know gold a lot better. So yeah, since we understand that gold move very very fast in both directions as you guys can see on the charts right now,
[02:41] sometimes you just go down, sometimes you just go up, sometimes you go down, sometimes you go up again. What you want to do is to scalp it instead of holding the trade for too long, right? So you don't try to catch the whole move, you
[02:53] just try to catch the cleanest part of the move itself. So yeah, I like to call this the get in, get out fast strategy or rather the ejaculate and evacuate that you get in, you know, do your thing, get the hell out ASAP, right?
[03:08] doing is to be caught in the reversal itself. Now with that being said, here's my brutally honest advice for beginner traders. If you are completely new to trading, you shouldn't be trading gold. What you really want to do is to master
[03:21] a few currency pairs like Euro USD, AUD USD, GBP USD. And once you get really good at navigating the price action on Forex, then you can consider stepping
[03:33] into the arena of trading gold. How I see it is like a video game. Forex is like, I don't know, level five. Gold is like level 20, right? So you cannot jump straight to level 20. You are just going to get slaughtered by that big boss,
[03:48] right? You want to fight the small minions first, then slowly work your way up to fighting the big boss at level 20. That's how I see it. That's what I tell my students all the time on my coaching calls with them is that you want to like
[04:00] just ease yourself into it. So yeah, if you're brand new to trading, consider starting with forex. But with that being said, if you're ready for go, this is exactly how I would trade it. So the first thing you want to do is to select
[04:12] a time frames. this whole scalping strategy runs on just three time frames. And that is the one hour time frame, which I use to figure out who's in control of price, to identify the trend direction. And then I
[04:25] also use the 15 minute time frame to find out where I'm allowed to trade, right? The location that I should be scanning for trading opportunities. Then I will drop down to the five minute time frame to look for my entry. So what you
[04:38] want to do is to add to favorites these three time frames, the one hour, the 15 can do is to just come in here, open your time frames, press this star right all three time frames, it will just pop up right here. So that's what you want
[04:53] to be your best friend for this entire strategy. This is what I call the market shift entry model. Now, another thing that you should consider doing is to add your long position and short position to your favorites toolbar just like this
[05:08] because this is what we are going to be using to forecast our trade, right? To set our stop loss, to set our take profit right here so we can see it visually before we actually input the figures onto our trading account, onto
[05:21] our trading broker itself. So yeah, feel free to pause this video right here and set this up on your own chart. And if you're also wondering what are these beautiful colors that I have on my candlesticks, it's not green or red,
[05:33] it's just black and gray. And the reason why I do this is because this helps me remove the emotions, right? Because your brain automatically associate green as go and red as stop, right? Green as good and red as bad. So when price starts
[05:46] position and you start seeing the red candlesticks, what tends to happen is that it trigger your fight or flight instinct, right? It calls you to get out pause the video right now and you can copy this exact same settings. And then
[06:00] for the white color candlesticks that you guys can see on screen right now. This is a secret indicator that we actually use, right? And this is like a students. So if you want to find out what are the white candlesticks, make
[06:13] sure you join the mentorship program. So instead of drawing you some perfect example or like something that I cherry pick, I'm just going to show you every step on the live market right now. So you can pretty much see how I would go
[06:25] about applying this strategy to the present, to the live market conditions. So let's start from the top with the one hour time frame. So the first thing you want to be doing is to find out who's in control of price. In order for you to
[06:37] whether that's the buyers or the sellers, you need to be analyzing your market structure. So if you look at a one hour market structure right here, you can clearly see that price is creating your lower highs and lower
[06:50] lows. But you can see there's also all of these internal movements that we have right here, all of these zigzags right here. And this is where a lot of traders might get confused. So you must understand that there are two types of
[07:02] structure, your swing structure and your internal structure. Some people like to structure, but it's pretty much the same thing. So first things first, go and mark up like what is the most obvious lower highs and lower lows, right? So we
[07:16] creating a lower highs and lower lows. In an uptrend price is creating a higher highs and higher lows. Like the next high is higher than the previous high, the next low is higher than the previous low. So if we look at a one hour time
[07:29] frame right now, we can clearly see that price goes down, made a very drastic pullback, goes down, make a very drastic pullback, goes down, make a drastic pullback and then goes down again. So this is what I mean when I say you want
[07:42] to look at the obvious structure first, right? So if you look at the obvious structure, you will see that hey, this is where we got a bearish break of structure and then this is where we got another bearish break of structure right
[07:55] here and then followed by this one right here. So this is where it becomes very clear that this is actually the swing structure. This is actually the external structure, which is pretty much this obvious swing points we can see on the
[08:09] charts right now. And now we also know that there is a second layer of market structure and that is the internal structure. The internal structure exists to support the swing structure. So what I basically mean by that is that you can
[08:22] see in this case when price make a pullback, it creates like a higher low, goes up. So it shifted bullish in the short term to facilitate the pullback. Once it's done pulling back, we pretty much got a market shift right here and
[08:34] then this is where price broke the last high, right, give us the market shift and price create lower highs and lower lows of the internal structure and then later on causing a break of structure to the downside on the swing structure
[08:47] itself. So just understand that everything in between your swing high and your swing low is your internal structure. So using that same logic, we is the highest point that led to this break of structure as the swing high,
[09:01] right. This would be my one hour swing high and then the lowest point that caused price to start pulling back, this would be my one hour swing low. So this here. So we also know that everything in between your swing high and your swing
[09:14] So all the stuff that we have going on right here, this is all your internal right here, this is all your internal structure. So once again, remember when price is creating lower highs and lower lows, this means that the sellers are in
[09:27] control. If price is creating higher highs and higher lows, this means that buyers are in control. So in this particular instance on the swing structure, we can clearly see that price is creating your lower highs and lower
[09:40] than this high, this low is lower than this low right here. So we know that the sellers are in control. There's a lot of supply in the market itself. That's what the swing structure is telling us. But what about the internal structure? So if
[09:53] you look at the internal structure, this is where we know that price is going down, right, creating the last lower high, comes down and then creates a new lower high right here, comes down and then this becomes the last internal
[10:06] internal lower high. And then what happened was that actually went up there and take out the last internal lower high. So when price internal lower high, this is where we got our market shift. This is where we
[10:21] that indicate to us that in the short term price has officially shifted bullish, right? Price has actually broke structure and right now price is potentially creating your higher high and higher lows, right? Because this
[10:36] high is higher than this previous high right here. And now it's potentially pulling back to create a new higher low to continue this bullish structure itself. So this is very important because a lot of people they only look
[10:48] at the swing structure. When you look at the swing structure, you might think that you are trading with the trend, but you're actually not trading with the internal order flow. And the internal order flow actually tells you who's in
[11:00] control of price right now. So in this case, internal structure is already bullish, right? But then the swing structure is actually bearish. So if we are scalping, do we want to be trading the internal structure or do we want to
[11:14] be trading with the swing structure? Well, we want to make sure that we take into account both, right? Because the swing structure still determines what price does on a macro level, but the internal structure determines what price
[11:27] does on the micro level. Now another nuance that you guys should take into account of is the fact that like when it comes to a break of structure, we want to get a candlestick closure. We don't just want a wick break. So once again,
[11:40] the devil's in the details. So in this case, price came down, pulls back, goes down and broke structure. So in this instance, when price came down and took out this low right here with a candlestick wick break like you guys can
[11:54] see right here, this is not counted as a break of structure, right? You can see it right here, wick break, no break of structure whatsoever. This could potentially be a liquidity sweep where price is sweeping this low right here
[12:07] now. Ideally, what we want to see is for the candlestick to close below the low, the candlestick close below the low? If there's no close, this is not a break of structure. Later on, price came down and finally close below the low. We can see
[12:23] this candlestick right here. It pretty much closed below the previous low itself. This means that this is a valid internal break of structure. The same thing applies when price goes up there and take out structure. When price go up
[12:36] the candlestick close above the high? Yes, it did. It closed above the high giving us a valid market shift. So that, ladies and gentlemen, is pretty much how you analyze the one hour time frame, how you really determine the market
[12:50] structure to see who's in control of price. So if you actually do that, you can see that, okay, this is the last break of structure. This becomes the internal low right here, and then this becomes the internal high, right? So
[13:04] And once again, it's very important for you to define your internal structure so that you can actually pay attention to what price is doing right now. Now that we have defined our internal structure, you can see that this is where we should
[13:18] be focusing on, right? Right here. Not all of this right here, but right here itself. So now that we know who's in control of price, right? So on the swing structure, it's pretty much the sellers. On the internal structure, it's pretty
[13:30] much the buyers. You want to know exactly where to sell or where to buy, which is the location. So in this particular instance, we know that, hey, objective of price? Well, price has just given us a market shift. So this could
[13:47] potentially mean that price is pulling back to like a demand zone that we have can expect price to go up there and continue this pullback itself if it doesn't have enough sellers, doesn't have enough supply for price to go down
[14:01] there's like those are like the two things that could potentially happen, right? Price could pull back to this demand, goes up, or it could come down this bearish structure. Now that we know that, we know that in the short term,
[14:15] to this area right here. And then from this area, we can either get this reaction right here or price goes down and take out this low right here, which brings us to step two, determine the location in which we should be scanning
[14:29] this is where things start to get interesting. This is where I want to start dropping down to my 15 minute time frame. Now once again, I'm not looking for an entry yet. I'm not deciding whether I should enter for a buy or a
[14:43] sell or rather like when exactly to enter. I'm not thinking about stop loss or take profit yet. No, I'm not thinking about sniper entries yet. All I'm doing is that I'm trying to mark out my locations, right? Which means that I'm
[14:57] thing I tend to look out for is the premium and discount, right? So I basically take the premium discount tool, drag it from the swing low to the swing high. Now I'm kind of getting ahead of myself right now, but yeah, let
[15:10] is premium and discount? So on this channel, I like to simplify things. I right? So comment down below if you guys love a in-depth breakdown just like this and also leave a like and subscribe. So what tends to happen is that premium
[15:25] discount allows you to determine which are the best location to enter for a trade. So if you guys want to get the tool, you can just go here and go to fib retracement and then you can just copy my exact settings that you can see on
[15:39] just pause this video once again and just copy it. Once you have copied this, discount and you want to drag it from the swing low to the swing high or the this case, once you drag it out just like this, you will see this is the 50%
[15:56] level which is the equilibrium line and above this equilibrium level, this is where price is in a premium. Below this equilibrium level, this is where price is in a discount, right? So when price is in a premium, I want to be looking
[16:08] for sell, right? Because price is considered as expensive, considered as overbought. When price is in the discount, we want to look for buys. So this is where price is considered as cheap, considered as oversold. So, we
[16:22] here. That's pretty much the gist of premium discount. So, today if I'm entering for a sell, ideally I want to sell somewhere around here. Today if I want to enter for a buy, right, to trade the bullish internal market structure,
[16:35] ideally I only want to enter for a buy when price cross below the equilibrium level, come down into like a location that we have down here, right? So, in this case, do we want to enter for a buy right here? Probably not, right? Because
[16:47] enter for a buy right here, you could potentially be trapped in the pullback, to this area right here. So, it's all discount, it just helps you out with timing. The next thing I look out for is
[17:01] a valid zone, right? Which is really the location I want to scan for my trading opportunities. So, in a uptrend, I want to buy at demand zones. In a downtrend, I want to sell the supply zones. So, in a uptrend just like this, we can
[17:15] identify a demand zone as an area well that led to a bullish break of structure that have a lot of buying momentum and buying pressure. So, in this case, price goes up, starts pulling back, goes up, starts pulling back and then goes up.
[17:29] So, you can see these are what we call demand zones, which is the origin point upside. So, whenever you guys see like huge bullish momentum just like this, you can see this one right here, usually indicated by multiple bullish
[17:44] candlesticks in a row, right? Like this, 1 2 3, 1 2 3, candlesticks in a row and you find the origin point which is the start of the move, that is where you can draw your demand zone itself. And you can see in
[17:58] this case, price pretty much just respected the previous demand zone right here, right? Pull back to this previous demand zone, goes up, pull back to the can see price respecting the demand zone, which also means that the next
[18:10] time price come back down to the demand zone, price is most likely going to push up as well. So, that's for demand and then in a downtrend, you want to sell at a supply zone. So, you can identify the supply zone at area where there's a lot
[18:22] of selling pressure, right? So in this case, this would be our supply zone right here, right? Because we can see price start going down, a lot of selling pressure, a lot of bearish momentum, and this is the origin point. So this also
[18:34] means that we can expect price to pull back to this area and then go down. Now attention to is liquidity, right? Liquidity is where traders have their Liquidity is where traders have their stop losses and stop orders at. So this
[18:47] is where it's usually above equal highs, right? Above equal highs just like this, there is liquidity. Below equal lows just like this, there is liquidity as well. Or in technically below every swing low and above every swing high,
[19:01] traders are placing their stop losses and stop orders. And it really act as the fuel that smart money need in order for it to manipulate price, in order for direction. Once again, we have a in-depth course on liquidity, so I'm not
[19:16] going to dive too deep into it because it's a very complicated sort of like a to check out videos on that, you can always find it on my YouTube channel. definitely go through the tutorials if you don't understand liquidity because
[19:29] like I always say, if you can't spot the liquidity, then you are the liquidity. want to see liquidity, right? So if we are entering for a sell, we want to see highs and this is where you can start looking for sells. If you're entering
[19:44] for a buy, we want to see price sweep the liquidity below the swing lows and that's the third thing that I look out for, which is the liquidity. Now these three things are just some of the things that I check for before I decide if a
[19:57] trade is an A plus setup or a B setup or a C setup. Because if it's a A plus setup, I'm willing to allocate more of my capital into it, right? Basically I'm going to enter the trade with a lot of confidence. But if it's a C setup, if
[20:11] it's a B setup, I would even consider staying off the market itself, right? Because I only want to be trading A plus setups itself. So I'm going to be breaking that entire grading process now live on real charts at my upcoming live
[20:26] trading boot camp, which is called the Market Mechanics Summit. This is where advanced market mechanics concepts. Whatever guys have learned so far, this is really like the tip of the iceberg. I'm going to go through my advanced
[20:38] during the summit itself, and it's from November 26th to the 28th. So if you ticket right now. The link is in the description. That being said, continue watching this video because step three is where most traders overthink it. So
[20:50] step three is deciding which direction I'm actually going to trade. And like I structure is currently bearish, but your internal structure is actually bullish. So if we want to trade the swing structure, then ideally we should be
[21:06] entering for shorts, right? We should be selling, and we should be selling at supply zone. If we want to trade the internal structure, we want to be internal structure, we want to be buying. So I personally always always
[21:18] prioritize the internal structure because that's what price is doing right now. I also make sure that I don't neglect the swing structure because the swing structure is still what controls the direction of price on a macro level,
[21:31] right? Which means the swing structure always takes precedence over the internal structure. And ideally, I want both to be aligned. Ideally, I want the swing structure to be bearish, internal structure also bearish. This is the best
[21:43] case scenarios, right? This is where we can just go and look for shorts with a everything's aligned, everything's on the same page itself. And this is where But then if they contradict each other,
[21:56] bearish, but internal structure is bullish, what you can do in this case is that you can try to trade the internal structure and still pay attention to
[22:08] right? So you can trade the 15-minute structure, but still pay attention to what price is doing on the 1-hour structure. But if you cannot tell who's in control of price at all, right? So you don't know whether the swing or
[22:21] bearish, right? Price is just doing like a very choppy price action like what can see on the screen right here. This is where you shouldn't trade at all, right? You should just stay out of the market completely. Don't develop a bias, don't
[22:33] trade, just stay out and just preserve your capital for the A plus setups that road. All right, so knowing that the internal structure is actually bullish right now, if we want to trade the
[22:45] internal structure, right, since price has just created a market shift just like this, what we can do is to obviously wait for price to pull back to a demand zone within the discount pricing, right? Because that's the ideal
[22:57] opportunities and then just continue we wait for price to pull back down to like a demand zone right here, and then when it does, we find our entry model and we can attack that area right here,
[23:11] enter for a buy order, and then just target wherever we want to target. Ideally, that's the best case scenario, but look at where price is at right now. Right now, price is not at the demand zone yet. Price, in fact, has just
[23:24] recently shifted bearish. You can see the internal structure that we have right here. This is the last internal high. Price has just broke that, right, which means this becomes the last internal low, and price has came down
[23:36] and took out the last internal low that we have right here. And this is our tells that there's a market shift on the internal structure. And once again, The reason why price have shifted
[23:49] bearish right here is because it's potentially pulling back to this demand that we have down here. So now, even though the internal structure is actually bullish, if we look at the 15-minute internal structure, right, not
[24:02] the 1-hour internal structure, 1-hour internal structure is still bullish, but if we look at the 15-minute internal structure, which is really exactly what you can establish the fact that sellers
[24:14] are actually in control of price, right? Price has already shifted bearish in the 15 minutes so they can facilitate the pullback right here. So the internal structure on the 15 minute is bearish, right? And this just nice is aligned
[24:27] with our structure, which is also bearish as well. So, if you're trying to where you can start looking for a sell shorts around this area right here when price is within the premium pricing and
[24:41] you can short it to this next demand zone that we have down here, right? objectively speaking where price is you know your direction that you should be trading, right? So, if you're
[24:53] entering for a longs, you can look for buy positions right here. If you're short position right here at this supply zone right here. But most traders lose the trade before it even starts, which brings me to step four. Step four is
[25:07] that you got to wait for price to come to you. You shouldn't chase price. You should just let price come to you, which also means you should let price come to one of your 15 minute zones. Now, once again, the biggest mistake I see a lot
[25:20] of people making is jumping to the lower time frames way too early and finding entries in the middle of nowhere. If price isn't in my zone, the five minute time frame doesn't exist. I don't give a about that at all. I want to see
[25:33] price step into the zone right here on the 15 minute, then I jump down to the five minute and look for my entry. Now, if price smashes right past through the zone just like this, right? You can see after price come into the zone, rather
[25:46] respecting it, it just blasts right to it just like this. This is where my setup is no longer valid. I don't argue with it. I don't negotiate with price. I simply just mark out a new zone and just wait for the next opportunity. I never
[26:02] opportunities. I let the opportunity come to me. I let the market come to me. Now, I want to be completely honest with you guys. Waiting for the right zone doesn't mean every trade will win. In fact, I waited for the right zone in
[26:16] this trade right here, which I actually taken a few weeks ago in Shanghai. Guess what? I end up losing the trade. End up losing 84k on this one trade itself. those examples where you do everything right and you still lose. Just for
[26:31] transparency purposes, I don't hide my losses like all of those trading gurus out there. I post all my losses, which is a lot of losses on my second channel Bread Trades as well. So just know that this strategy doesn't work 100% of the
[26:45] time. It's not a 99% holy grail If you're seeking for that, you can search somewhere else. Like in this example, I pretty much got the internal structure wrong. Pretty much became the exit
[26:57] liquidity itself. It's part of trading, right? Losses are really part of the game itself. That's exactly why you need to practice proper risk management, which I'm going to show you later at the end. Now let's move on to the final step
[27:09] of this strategy, and that is your entries. Now once price gets into the zone, right? Like let's say we are looking for a sell and price comes up here and dip into the supply zone. This is where I'm going down to the 5-minute
[27:22] searching for my market shift entry model. So once you get there, there are a few things I look out for, three things to be exact. Number one, I want price go up there, take out some form of liquidity above a swing high just like
[27:35] this, above a internal high, and then go down. I want to see that V-shaped reaction because that is really the fuel it needs to cause price to coming down. Number two, I want to see a market shift, right? I want to see a candle
[27:47] close beyond the internal structure right here, giving us a market shift. And remember, we have to get a candlestick body close, not a wick break number three, I want to see price retracing back to like a 5-minute zone
[28:02] that has just been created. And I will only get in if I can have like at least risk to reward, right? I enter for a sell right here, place my stop loss above the high or above the 5-minute supply zone right here. This is where I
[28:16] would pretty much place my take profit at let's say 2R or the next sort of technical level right here, which could be like a next 5-minute demand zone. I will only enter if it's at least 2R, which means I'm getting back in return
[28:29] twice as much as I'm risking. So since price haven't really came up to this area right here, I can't really show you guys what that looks like other than my awesome, beautiful drawings. Maybe what I can show you is something like this.
[28:41] So let's say this right here is the supply zone, right? And price have came first thing I look out for is the liquidity sweep. Honestly, price stick short. So in this case, we got price coming down up here and sweep this high
[28:56] little liquidity. Next thing I look out for is a market shift. I want to see price come down and take out the last low, right? So this is the last low, so We don't want to see a wick break just like this, right? This is not enough.
[29:09] the candlestick close below the low just like this. Candlestick close below the this is where we can draw our five minute supply zone, our new lower time frame supply zone, and I just wait for price to pull back to that five minute
[29:23] maybe I wait for price to pull back to this supply zone. And when that happens, then I look for short from there. And this is where I'm placing my stop loss either above the supply zone, above this new high that's been created right here.
[29:37] And this is where I'm placing my take profit at either two R, right? Just two R just like this, or I'm placing at the next five minute demand zone, right? So zone, I'm targeting the next demand zone. If I'm looking for a buy at a
[29:51] demand zone, I'm targeting the next supply zone, right? Really just as target the next demand zone and I realize that it's just one is to six, it's not two, then I will pass on this trade itself. I will just completely
[30:04] stay out of the market and not enter for the trade itself. I want to have at least two R on the trade itself just like this. So yeah, if you look at the trades that I've shown you guys at the start of this entire lecture right here,
[30:18] you will see that on both of my gold trades, I have at least like a four R, right? So in this case, I'm risking 64 K to make over 300 K. Pretty worth it. In this other case, I 'm risking around 62 K to make 270 K. So once again, I'm
[30:33] always trying to get back in return so much more times compared to what I'm risking. So if you're wondering how I manage my risk consistently all the time, it's really thanks to Edge Flow. On Edge Flow, I actually set my risk per
[30:47] On Edge Flow, I actually set my risk per trade to about 0.5% to 1% of my capital. So in this case, if I come to gold and I press trade, you can see in this case, let's say I enter for a buy, my risk per trade is automatically set at 0.5%
[31:02] settings. And I can just come in here and just put my stop loss, right? Use say I enter place my stop loss below the low and place my take profit right here. And you can see the lot size is automatically calculated within a few
[31:16] seconds based on your stop loss, right? So it pretty much tell you that, hey, in So it pretty much tell you that, hey, in order for you to actually risk 31k, right? 0.5% of your capital on this trade itself, you got to be using 82.41
[31:29] right now because the entry price is fluctuating, right? So you are always getting in at the most accurate lot size. And then when it comes to your stop loss and take profit, you can just easily put them based on the trend lines
[31:42] done in 5 seconds. And you can also visualize what is your risk to reward, right? What is your R multiple, right? So in this case, it's what is the 1.6. something like this, right? 2R right here, which means I'm risking 31k to
[31:56] make about 63k in return. Pretty decent. This just saved me a lot of time when over there thinking about, oh my god, what lot size should I use for gold? How discipline is built into your trading system when you actually use Edge Flow.
[32:11] It's all about the person who can, you know, get in with sniper-like precision. And I do that with Edge Flow super duper fast. So yeah, that's pretty much the whole entry model. But with that being said, you will almost always fail at
[32:26] trading. You will fail to make money consistently if you don't take risk are the rules that keep me in the game. And I've got all of them set up as guard the trading platform that I've built to help traders. So that when I hit one, it
[32:41] literally stops me from trading. So I pretty much risk about 0.5% to 1% of my capital on any given trade right here. And I pretty much have like a max daily loss of 2%, right? So if I'm down 2% on the day itself, I stop trading. This
[32:56] prevents me from revenge trading. And I also have like a max daily profit. So if I'm up 5% of the day, I also stop, right? Once again, this locks in a giving the profits that I've made back to the market via overtrading. I also
[33:11] have a max trades of three trades a day, right? Once again, prevents overtrading. And I also only trade during the London session exclusively, right? So I have this trading window which blocks trading outside of this window because London
[33:24] session is when there's the most amount of trading opportunities and is also the time where it fits my schedule the most. And last but not least, we also got a news block, right? Which pretty much means that I stay out for 15 minutes
[33:36] before and after high impact news that affect US dollar, right? So this means that any US dollar news that affect gold, right? That can cause price of involved in that right? I'm not going to get trapped in the market
[33:49] manipulation. So yeah, that's the entire five steps, right? That's the entire scalping strategy. If any piece is missing, whether that's the bias, the zone, the liquidity sweep, the market shift, there's no trade whatsoever. And
[34:03] price breaks past the zone, like in this case, let's say you are supposed to enter for a sell at this zone, but later on price break past the zone just like this, this is not a valid trade ideal, right? There's no trade
[34:17] whatsoever right here. This is where the setups did and I'm going to look for the case, price take out the zone right here. Now he has given me a liquidity sweep right here, right? Nice cheeky little liquidity sweep. And we also got
[34:30] a market shift right here. Okay, and then this becomes the new supply zone too. So this is where I can look for shorts right here. And once again, place your stop loss above the supply and target two R or the next demand zone on
[34:45] the five minute time frame or whatever level you like to target itself. So that being said, you can know every rule in this video and still take the wrong trades because a lot of traders just can't tell an A plus setup from a B
[34:59] setup from a C setup. And a lot of them, they just waste a lot of their trading capital on the B and C setups. And as a result, they don't have any capital left to take the A plus setups, the setups that actually make them money. And once
[35:11] going through live with you at the Market Mechanics Summit along with advanced market mechanics concepts along with my complete trading routine and also my entire mechanical trading system, right? The same system that made
[35:25] I'm going to go through everything with you. I'm going to leave no stone unturned during the upcoming Market Mechanics Summit from November 26th to the 28th. So make sure you click the first link in the description to save
[35:38] you there. With that being said, remember you're just one trade away.
The video opens with a bold claim of making over half a million dollars, immediately piquing curiosity. The promise of revealing a 'secret' strategy creates a gap between what viewers know and what they could learn, compelling them to watch.
I made [NUMBER] in [TIME] with this [STRATEGY]. Here's the exact [STEPS] I used, and it fixes the reason most [AUDIENCE] fail at [TOPIC].
AI-generated clip ideas for Shorts based on the transcript
The massive profit claim immediately grabs attention and sets up high expectations, making viewers want to learn the strategy.
▶ Play ClipThe blunt advice to avoid gold and the video game analogy (level 5 vs level 20) is relatable and controversial, sparking debate.
▶ Play ClipThis segment clearly explains the multi-timeframe analysis (1H, 15M, 5M) with a visual example, providing high educational value for traders.
▶ Play ClipThe concept of premium and discount is a popular and visually intuitive trading idea that viewers find intriguing and want to learn more about.
▶ Play ClipThe honesty about a massive loss on a textbook setup humanizes the trader and creates a compelling narrative about risk management.
▶ Play ClipSnapshot 2026-11-18
Every observation TubeSum recorded, plotted as measured.
The vertical axis starts at 311K, not zero, so later observations stay readable.
Based on 3 observations · last observed Nov 18, 2026 · solid lines connect consecutive measurements (≤2 days apart); dashed lines span days TubeSum did not measure. · vertical axis focused on the observed range (starts at 311K)
Based on 3 observations · last observed Nov 18, 2026 · solid lines connect consecutive measurements (≤2 days apart); dashed lines span days TubeSum did not measure. · vertical axis from zero
Exact daily observations; gaps mean no observation was taken that day.
| Date | Views | Avg views / hour | Channel median |
|---|---|---|---|
| 2026-11-18 | 371,031 | 3,373.0 | 161,042 |
| 2026-11-17 | 326,885 | 4,086.1 | 161,042 |
| 2026-11-16 | 313,610 | 4,417.0 | — |
Audience reaction — separate from the performance metrics above.