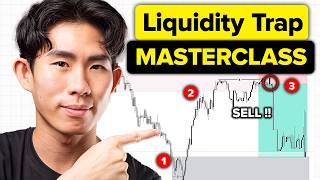

Most traders don't understand liquidity
45sImmediately challenges the viewer's knowledge, creating a curiosity gap that makes them want to learn the secret.
▶ Play Clip"Delivers a solid framework for ranking liquidity, though the 'secrets' are more methodical than revolutionary."
This video presents a structured framework for ranking liquidity levels in trading, moving beyond simple identification to prioritize which liquidity price is most likely to target. The presenter demonstrates the process on real charts, emphasizing the importance of building a narrative around price action and distinguishing between internal and external liquidity.
Most traders can identify liquidity but don't know how to trade it because liquidity exists above, below, and across all timeframes. The real challenge is determining which liquidity price will target next.
Traders often mark every equal high, equal low, swing high, and swing low as available liquidity, assuming price must take all of it. In reality, some liquidity is noise, and the closest liquidity isn't necessarily the target.
The trader's job is not just to find liquidity but to rank it. Ask: which liquidity is most likely to be taken first? What is the objective of price? How does this sweep fit the narrative?
Higher timeframes determine trend direction and identify external liquidity (the destination). Lower timeframes provide entry confirmation and identify internal liquidity (the journey).
External liquidity sits at the extremes of a range (swing highs/lows, prior day high/low). Internal liquidity is found within the range (minor highs/lows, inducements, short-term liquidity).
Ask what liquidity has already been taken. A liquidity sweep alone means little; what happens after the sweep matters more. Strong displacement after a sweep indicates momentum.
Enter on a sweep of internal liquidity with confluence (e.g., supply zone). Place stop loss beyond the sweep, and take profit at the opposing external liquidity.
Don't force a trade bias when structure is messy. Stay on the sidelines, observe, and wait for a clear opportunity. Professional trading is about knowing when not to trade.
The key to trading liquidity is ranking it: identify external liquidity on higher timeframes as the destination, use internal liquidity on lower timeframes as the journey, and only trade when multiple confluences align. Accept uncertainty and avoid forcing trades.
Rank Liquidity, Not Just Find It
Shifts the trader's mindset from passive identification to active prioritization, which is the core of the framework.
03:28External vs. Internal Liquidity Defined
Provides clear definitions that are essential for applying the framework correctly.
08:55Avoid Forcing Trades
Emphasizes the importance of patience and discipline, a key trait of professional traders.
24:01Knowing When Not to Trade
Highlights that professional trading is about capital preservation and edge recognition, not prediction.
26:58[00:02] Liquidity this, liquidity that, but the truth is most traders don't actually understand liquidity. I mean like they say they do, like they know what liquidity is, they know how to mark it out, but they don't actually know how to
[00:17] trade it. Because the thing about liquidity is that it is literally everywhere. There's liquidity above price, below price, on the higher time frame, on the lower time frame, and if that's the case, how do you actually
[00:30] know which liquidity is price going to target next? So, in this video I'm going to show you exactly how I determine which liquidity is actually important, which liquidity is probably just noise, and how I build a narrative around where
[00:44] price is most likely to go next. And most importantly, I'm going to show you this on real charts [music] so you can see exactly how I think about liquidity before this video starts, you must understand that this video is not for
[00:58] beginners, which means that if you don't understand inducements or liquidity concepts, I highly recommend you to check out this 1-hour training that I did on liquidity concepts [music] as part of my free 33-day Market Mechanics
[01:11] Mentorship Series. Right? So, go and make sure you watch that, you finish that, you understand how to spot inducements and liquidity. Once you do, you can come back and watch this video. But yeah, if you don't do that first,
[01:23] you will not be able to understand anything that I'm talking about in this video. I will sound like I'm speaking a foreign language other than English to you, right? So, make sure you go and get that solid foundation built before you
[01:35] Now, if you do understand the basics of liquidity, i.e. where liquidity is, what is actually liquidity, then you will really enjoy this video. All right, so the first thing you must understand is that every high and low technically has
[01:51] is buy-side liquidity above this high, and this low. So, simply spotting liquidity is pretty useless. Like, everybody can spot liquidity. The hard part is knowing
[02:06] which liquidity is most likely going to get taken, and is going to be used to fuel the move to the other side. And the biggest mistake that a lot of traders the start before they met me, is that they tend to mark every equal high and
[02:21] every equal lows and every single swing low and swing high that they see as available liquidity. And they assume that price has to take all of this liquidity right here. The truth is, some of this liquidity is
[02:35] Which means smart money will eventually take those before fueling the real move. take those before fueling the real move. But, a lot of this is also just noise. Like, in this example right here, the price went up, pulls back, and then goes
[02:48] up, and then starts pulling back. So, this is where a lot of traders will assume that all price is going to do is that it's going to come down here and this low right here, and then price can go up, right? So, they assume that price
[03:03] When in reality, that might not be the here, sweep the liquidity below this low right here, the external liquidity, which is a concept I'm going to walk you through later, before price goes up. So,
[03:16] through later, before price goes up. So, the closest liquidity isn't necessarily the liquidity price is actually targeting. So, remember this, right? I want you guys to write this down somewhere.
[03:28] Your job as a trader isn't just to find liquidity. Your job is to rank liquidity. To ask yourself, which liquidity is most likely going to get taken first? What is the objective of price? And how does this
[03:44] liquidity sweep fit in the objective, the narrative as to like what price is being said, let me walk you through my entire process in terms of how to correctly. So, right now we are analyzing US 30, which is an indices,
[03:59] but understand that this strategy works on all asset classes, crypto, forex, stocks, futures, whatever that you trade, as long as it has a candlestick I'm analyzing the charts on Edge Flow, which is my discipline first trading
[04:12] platform, where you can do your pre-market, in-market, and post-market you can execute trades with discipline here. You can journal your trades, you can do everything you need to do as a trader on this platform itself, right?
[04:25] That's how awesome this platform truly is. So, yeah, shoutout to Edge Flow, and shoutout to the founder who built Edge Flow, okay? Like, this is one of those platforms that genuinely wants you to succeed as a trader, that genuinely
[04:37] wants you to win, right? So, with that being said, enough of me shamelessly promoting my own platform. So, let's get into the liquidity targeting framework. pretty cool name for this strategy, all right? So, how this strategy actually
[04:49] works is that it requires you to build a narrative of price, right? So, it's a very sort of methodical framework in is laid out in here, in this exact order, in this exact manner. So, the
[05:03] every single time frame serves a different purpose. The higher time frame and the lower time frame, they should be used for different things. For me time frame to identify my trend direction, to see who's in control of
[05:18] price, supply or demand, buyers or sellers, and then I like to use the lower time frame to look for my entry confirmation, my entry signal to tell me when exactly to get in, right? Which is why the first step of this entire
[05:31] strategy requires you to actually look at the higher time frame. To be very specific, is to identify the liquidity on the higher time frame. So, I believe frame to determine the destination, which is like where price is trying to
[05:46] go next. And then use the lower time frame to understand how price might get there. Right? So, the lower time frame facilitates the higher time frame. Like price has to move first on the lower time frame before the higher time frame
[06:00] about, you know, the liquidity on the 1-minute or the 5-minute time frame, the lower time frame, I want to understand what the 4-hour time frame or the 1-hour is where I can obviously see price went up, came down, swept the liquidity below
[06:15] cheeky low liquidity sweep right there. So, I can just label that up as like a nice low liquidity sweep before price creates like this V-shaped reaction and it goes up there and take out the last swing high just like this, giving us a
[06:31] bullish break of structure to the upside. Right? So, when this happens, this tells us that obviously the buyers are in control of price. Right? Price is potentially going to create like a new higher low right here before price
[06:43] continue going up. So, once again, before you jump down to the lower time frame, you really want to make sure that you identify your trend direction, So, since this is the break of structure, this becomes the swing low
[06:56] and this becomes the swing high, which means this is the range in which we are not going to care about what price does here or here or here. I'm only going to be caring about what price does within this range, right? This grounds
[07:09] you in the present moment so you can see the market for what it actually is. So, this is where I'm analyzing the higher time frame and I'm looking at where price is currently sitting right now within the entire larger structure that
[07:21] I've mapped out right here. And where liquidity has already been taken and where liquidity has not been swept yet, right? Like where is the available identified that price already came down here and swept the liquidity below this
[07:35] low, right? So, this becomes the new protected low, which is really just a term that says that a swing low has now swept liquidity on the previous low and is somewhat protected in the sense of like price is most likely going to
[07:47] respect that level when they come back down to this level. With that being said, after all, it is still a swing low, right? Which means that it's still a chance for price to sweep the liquidity below this low right here. So,
[07:59] this is where we can identify that, "Hey, there is liquidity sitting below this swing low right here and perhaps even above this swing high here as well, right? So, that is pretty much your external liquidity that you identify on
[08:12] question I always ask myself when I'm doing this. If I zoomed out and I couldn't see any lower time frame noise, where does price delivered, right? Which means it's like, "Where is price most likely going to go
[08:27] action that we have on the higher time frame structure, right?" So, in this potentially come down here, respect this previous low, and then starts going up. there's not enough liquidity right here, not enough fuel for price to go up,
[08:42] price can come down here, sweep this low, and then go up as well. Right? So, it might want to come down here and take the higher time frame external liquidity potentially happen, too. So, yeah, once again, that's the concept of external
[08:55] liquidity. External liquidity is generally around the extremes of the range, right? The extreme swing low, the extreme swing high. And then, internal liquidity is whatever liquidity that you can identify inside
[09:10] and the swing high. So, I'm going to put some examples of external liquidity on swing highs and lows, like what I've identified right here. There's liquidity high right here. Uh at the extreme of the range itself,
[09:26] right? So, for example, if this is a consolidation just like this, there is going to be liquidity above the high of the range and also below the low of the the range and also below the low of the range itself. And also prior day high
[09:38] and prior day low, right? Which means the previous day high and low, like what the name suggests, or the extremes that was formed during a specific session, i.e. the London or New York session. So, yeah, that's the
[09:50] are pretty much done with step one and step two. We have marked our higher time frame external liquidity. We have also determined our higher time frame draw on external liquidity that is situated at a swing low and a swing high. The next
[10:04] step is to mark up the internal liquidity, right? Which is another through. Now, would you trust a trader who only ever shows you his [music] wins? I wouldn't. And that is exactly why I've been documenting my trading
[10:19] journey on YouTube for the past 7 years, showing both the wins and the losses. The system I kept refining over those 7 years has helped me build a portfolio of over $10 million, and this November I'm breaking down its
[10:34] foundations at the upcoming Market Mechanics [music] Summit. From November 26th through the 28th, you will get three intensive live days with me. On day one, I will show you how to see the market and understand what price is
[10:47] actually doing using market mechanics. On day two, we will turn the analysis into a mechanical trading system with specific rules for your setups, entries, exits, and risks. [music] And then on day three, we will go deeper into
[11:02] advanced market mechanics concepts, and I will map out my 90-day funded trader roadmap, so you know what to focus on as you build consistency, prepare for funding, and eventually scale. I'm also giving you some of the same workbooks
[11:17] and templates that I use myself, so you can work through the lessons and start building the same type of structured trading routine that I use [music] on a daily basis. So, if you want to learn how to execute with the structure and
[11:29] discipline of a professional trader, click on this video and grab a ticket right now. Right, internal liquidity is pretty much like what I mentioned earlier, the liquidity between the swing low and the
[11:42] swing high. So, you can pretty much just spot the internal liquidity right now on this existing higher time frame without even jumping down to the lower time frame. Right? So, if you look at this, what happened was that price goes up,
[11:54] pulls back, and then goes up, pulls back, goes up, pulls back, and then goes up. Right? So, it create like this minor internal sort of retracements and pullbacks when price is going up just like this. And we know
[12:09] liquidity, right? All of these low right here. So, this becomes your internal liquidity, right? Which is like the smaller lows or highs that is formed within the range, right? Any sort of
[12:22] inducement that you can find in here, any short-term liquidity, any liquidity created during the delivery of price, during the retracement of price. Right? we have in here in the range itself, these are all like internal liquidity.
[12:38] So, like I said earlier, internal liquidity acts as part of the journey rather than the final destination. Right? So, it's like the internal journey is just a fuel that price needs in the short term for it to move in the
[12:51] direction it's meant to move in. Right? So, for example, during the continuation whatever liquidity that they can find below these lows right here to like just upside. And then during the retracement, during the pullback phase, price is
[13:06] liquidity just like this one right here. Came up there, swept the internal there, and then now it's going to continue going down. Right? So, it's like short-term fuel, right? In which price is going to take advantage of so
[13:21] move, right? So, it can really once again fulfill the objective of the higher time frame. So, like, price can move against your direction of buyers, sweep internal liquidity, and then continue toward your external target
[13:35] before price can go continue going up. So, basically, what I'm trying to say is that price can take internal liquidity on the way toward external liquidity. to make is treating every single one of these little internal move right here as
[13:50] the ultimate destination for where price is going to go. When in reality, it's is going to go. When in reality, it's just a cog in the entire machine. It's just a tiny piece of the puzzle. Right? It's just a little portion of the entire
[14:04] pie. So, if you fail to identify your external liquidity, if you fail to look from a high level like a bird's-eye view, you might get lost in terms of like whatever that's going on right here
[14:17] on the internal liquidity on on the lower time frame itself. Let's jump down make things a little bit more clearer for you guys. And this is where you can see that we are pretty much in that pullback in that retracement phase right
[14:30] now. Because after a break of structure just like this, we are expecting price to pull back. And where's price going to pull back to? Potentially to this swing low right here. And if you guys use supply and demand, you can also map
[14:42] these demand zones right here in which price is potentially moving toward next. Right? Demand zones over here, here, and also over here. Right? So, these are the zones in which price is going to move toward next. Then might as well any
[14:55] here, mitigate one of these zones, and then just switch bullish because there's just to be clear, right now the objective of price is that it has shifted bearish in the short term to facilitate the pullback, which means
[15:11] that it's just going to continue going down. And if it wants to continue going down, it needs fuel from the buy side. Right? It needs buy side liquidity, that price is going to come down here, pulls back, create like an inducement,
[15:25] which is like a trap that is laid out by smart money to entice retail traders to enter for a position too early, right? You can see in this case, this is like a equal highs, right? Classic little liquidity sweep right here. Later on,
[15:38] price went up there, swept the liquidity above the equal highs, and then start side liquidity, and then starts going down. So, this is a very classic example of internal liquidity. Which also brings us to the next step, which is
[15:51] identifying the liquidity that's already been taken, right? So, in this case, covered right here. Where price really went up there, swept all of these highs that we have marked up right here, swept all of those things before we got a
[16:05] actually started coming down, right? So, classic liquidity sweep right here. this one right here, where price goes internal high, before price later on came up there, swept the internal high,
[16:19] just like what we have right here, before continuing going down. So, yeah, don't just ask yourself, where's the available liquidity? Ask yourself, what liquidity has already been taken? Because like a liquidity sweep by itself
[16:32] means very little. What happens after the sweep matters much more. Like in price have pretty much went up there and take out the buy side liquidity, and caused this significant reversal right here. So, now I could potentially expect
[16:46] it to come down and sweep the available liquidity below this low right here, liquidity below this low right here, which is the sell side liquidity. And just like that, it did exactly that, right? Price came up came down here,
[16:58] here, before goes up, and then remains stuck in this consolidation here. And after liquidity is taken, what you really want to see is how aggressively price move away from that area, right? So, in this case, after price swept the
[17:11] lot of selling pressure, a lot of selling momentum, causes price to do like a 180, and straight away just come down here and take out all of these lows right here, all of this liquidity here. So, strong displacement, strong momentum
[17:25] just like this tells us that a lot of sellers have actually stepped into the market right here, right? And this is where price is about to collapse. So, has already swept the buy-side liquidity, now we're expecting price to
[17:38] come down and sweep the sell-side liquidity, right? Which is the on the expecting price to come down and sweep these lows right here. So, if you are purely trading the internal liquidity, internal structure, what you could have
[17:51] perhaps done in this case is to enter for a sell when price sweep all of these loss above the protected high, which is the high that's already swept liquidity, and then target the opposing side, which
[18:03] is somewhere around here, right? Which is where the sell-side liquidity is at, right? You can see this will be a like a pretty nice 1:2 R trade. So, with that higher time frame just to see where price is at once again, and you realize
[18:17] nowhere, which means that it's really a lot more room for price to continue going down, right? So, remember your external liquidity below this low and above this high right here. So, maybe before price wants to go up, it needs to
[18:29] get more fuel, and if there's not enough fuel at this area right here, it's going liquidity below this low right here, and then goes up. And then if there's not liquidity, it's going to continue coming down here and sweep the next internal
[18:44] there's not enough fuel at this next one, then guess what? The only place it can go to it's next is going to come down here and sweep the external liquidity below this swing low, and then cause price to go up, right? So, once
[18:58] again, that's the objective of price. That's the destination of price. So, we just know that price is going to continue going down. So, if I were trading this exact price action, I'm I'm going to be looking for shorts. I'm just
[19:11] right here. But, I'm not going to look remember, I need to get my liquidity sweep taken. And in a pullback just like this, in a downtrend just like this, we want to see price sweep your buy-side
[19:26] liquidity, and that is where we can look to get in for shorts, right? So, in this in on this trade, I'm going down to the lower timeframe. I'm identifying the internal liquidity just to make things more clearer for you guys. This right
[19:40] here was the last protected high in the sense of that was the last high that swept liquidity. So, this becomes the high of the range, and this becomes the low of the range itself. So, right now, if we are trying to get in for a sell,
[19:55] available liquidity before continuing going down, right? So, in this case, price went up there, pulls back, goes up, pulls back, goes up, pulls back, and then goes up, and then cuts start coming down. So, creating all of these internal
[20:08] highs, which means all of these are simply just liquidity building up above these highs right here. So, ideally, you should combine your liquidity concepts concepts, and if you do, you will know that this right here is a supply zone,
[20:23] right? And then all of these are also supply zone right here. And pretty much whatever I just walked you guys through on the higher timeframe, it literally applies right here as well. So, in this
[20:35] price to come up to either one of these supply zone right here. And then if it take out the internal liquidity and there's enough fuel, you can potentially look to short it down, and then you can look to target the opposing liquidity,
[20:49] right? So, for example, in this case, if price comes up here, sweep the liquidity low, I'm getting in for a sell right here if I get my entry confirmation, and then I'm going to be pretty much placing my stop loss above the high right here,
[21:04] and I'm my take profit at the opposing end of the liquidity spectrum, right? Which means if I'm selling at buy side liquidity, I'm going to be taking profit at the next sell side liquidity, right?
[21:17] probably somewhere around here or wherever the nearest swing low actually is. And that's pretty much the entry criteria and the exit criteria itself, right? Stop loss beyond the liquidity sweep or whatever price might invalidate
[21:32] the trade ideal and take profit at the predetermine external liquidity or the opposing liquidity. So, in this example, let's say there was not enough entered for a sell position right here. You try to target below this low right
[21:47] here, but then price actually came down here and I started reversing, reversing and continue going up and stopped you out. So, in this example, you must understand why you got stopped out. The reason why you got stopped out
[22:01] is because this internal liquidity was not enough, right? Was not enough fuel for price to continue going down. So, as a result, it might come here, sweep the liquidity that we have below these lows right here or something like uh do your
[22:14] sweep the buy side sell side liquidity and then it starts going up here and then it's attracted to the next internal liquidity, which is this one right here. have enough momentum, it's going to go up here and sweep this one right here
[22:27] and then so on and so forth, right? Until price eventually got the sell orders that in it, eventually got the selling pressure that in it and cause price to continue going down. And like I said, if all of these internal liquidity
[22:39] is not enough, then guess where price is going to go next. It's going to go and sweep the external liquidity. So, in this case, on the 1-hour time frame, this was the 1-hour high and 1-hour low that we have established, right? Within
[22:52] And we know that there is external liquidity sitting above the high and the low, right? So, internal liquidity, if it's not enough, the only next place logically as like where price will move to it next, is
[23:07] going to be above this high right here, right, to sweep the final buy side liquidity before price actually reverse. And then if some reason there is still price to reverse, then that's where we can expect a complete reversal and we
[23:21] get a market shift and price is going to shift from bearish to bullish. Yeah, you can see how sequential this entire process is. It's like you want to see the internal liquidity get swept first and hopefully there's enough fuel for
[23:34] price to go down. If not, then we can expect the external liquidity to get taken out. What you don't want to do is to assume that this internal liquidity Like, oh, I'm going to enter for sale
[23:47] down. No, that's not the case because if there's not enough fuel, price can go up liquidity and if there's still not enough fuel, price can go up there and take the external liquidity and then go down. So once again, just to sum up the
[24:01] entire process, what you don't want to do is, oh, there is a equal highs here, so I'm just going to sell. Oh, there's equal lows here, I'm just going to enter for a buy. No, that's not how liquidity works, right? That's how stupid retail
[24:15] start with the higher time frame trend direction and then identify the external liquidity so you can kind of know, kind of gauge where price is gravitating to And then also what you want to do is to
[24:29] right? So you can identify the protected structure, the places where price is you can go down to your lower time frame or look at the internal structure to find your internal liquidity uh to like
[24:41] then if your entry confluence has presented itself, you know, you got uh because you got a trade idea at a internal liquidity being swept, right? By all means, you can go and execute the
[24:54] trade and manage the trade in this exact manner here. So, I want multiple pieces of information telling the same story rather than relying on one concept, right? So, I want to make sure that the internal and external liquidity is kind
[25:07] to take the internal before it takes the that the internal structure is aligned with the external swing structure so that, you know, I have like full trade alignment. I have pretty much all the
[25:20] confluences, all the evidence in the market for me to be confident in my trade bias. Now, with that being said, before you go out there and try to think that this is a 100% win rate trading strategy because Brett says so, no, it's
[25:33] not. Because like, honest to God, sometimes I genuinely cannot even tell which side price wants to take. And that's completely fine. That That's okay, right? You If the structure is incredibly messy, you know, price is
[25:48] doing this weird consolidation price action where both sides have meaningful side or the sell side and the sell side, and price just isn't showing any like intent, and there's just like not a clear trading opportunity, what you
[26:03] don't want to do is to force a trade bias. What you don't want to do is to impose and just manufacture a trade bias out of nowhere, right? Just so that you money for today, just so that you can actually, you know, freaking get to
[26:17] possible. That's not what you want, right? What you want is to become comfortable with I don't know. Become comfortable with the uncertainty of the market, right? Because like, that's just the nature of the beast. And in those
[26:31] situations, if you really don't know what's going to happen, what you can do is to stay on the sidelines and just watch, just observe, right? Maybe wait for one side to get taken out and let the reaction give you more information
[26:45] to tell you whether price is going to go down or go up, and then decide what's the right course of action based on whatever the market does. Because remember, being a professional trader isn't about predicting every move. It's
[26:58] about knowing when you actually have an edge and when you don't. Right? It's about knowing when to trade, but most importantly, knowing when not to trade. your capital so that when the opportunity do appear, you can actually
[27:12] allocate your capital in the right way. So, with that being said, I hope you guys have enjoyed this video itself. If you guys want to learn more about concepts, check out my free market mechanics playlist right here. Right?
[27:26] You will learn everything you need to know about trading profitably in this free playlist right here. So, please go and check it out. Yeah, just this profitable. With that being said, as always, remember, you're just one trade
[27:43] always, remember, you're just one trade away.


⚡ Saved you 0h 27m reading this? Transcribe any YouTube video for free — no signup needed.