Why You Keep Getting Trapped in the Market
45sDirectly addresses a common pain point for traders, promising a solution to a frustrating problem.
▶ Play Clip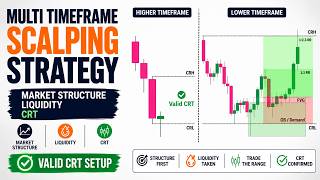
"Delivers a solid, structured lesson on market structure and CRT, but the 'Advanced Scalping Strategy' title oversells; it's more of a foundational tutorial."
This video provides a comprehensive guide to reading market structure, defining trading ranges, and executing trades using Candle Range Theory (CRT). It emphasizes the importance of understanding market context before applying any advanced concepts, and demonstrates how to combine structure, liquidity, and CRT for high-probability setups.
Understanding market structure is critical for survival and consistency. Misunderstanding context leads to constant traps regardless of entry quality.
Price moves through uptrend, downtrend, or consolidation. Before marking zones or choosing bias, this foundation must be clear.
An uptrend consists of higher highs and higher lows. It ends when price breaks below a significant low. Major lows must remain unbroken for continuity.
The major high is the peak before a retracement; the major low is the lowest point before the bullish wave that led to a break of structure. These form external structures; everything between is internal.
A trading range is not just a box; it's where price delivers and liquidity builds. Identify it on a higher time frame (e.g., 15-min for 1-min execution).
A valid range requires a confirmed impulse leg that breaks structure, with price retracing into the discount zone (below 50% Fibonacci) before continuing. The range is confirmed when price breaks the most recent internal low.
CRT treats each candlestick as a trading range. Its high and low act as liquidity levels. The classic model uses three candles: range, sweep, entry.
Candle Range High (CRH) has buy-side liquidity (BSL) above; Candle Range Low (CRL) has sell-side liquidity (SSL) below. These levels attract stops and orders.
A sweep occurs when price moves beyond CRH/CRL and closes back inside. If the second candle closes decisively outside, the setup is invalid.
Commonly, the 1-hour candle before the New York session open is used because NY often sweeps London liquidity and reverses.
In an uptrend, apply CRT to bearish candles during corrections. Wait for a sweep below the low and close back inside. In a downtrend, use bullish candles in premium zones.
Drop to a lower time frame (e.g., 5-min) and enter at a fair value gap (FVG) that forms after the sweep. Place stop loss just beyond the gap.
Take partial profit at 1:1 risk-to-reward to make the trade risk-free, then let the rest run to a major structure level.
Avoid using CRT in choppy markets, entering before the candle closes, and ignoring broader context like news or daily levels.
The video demonstrates CRT on EUR/USD 1-hour chart, showing valid sweeps, FVG entries, and trade management with partial profits.
Mastering market structure and CRT allows traders to trade with precision and context, avoiding guesswork. Combining trend direction, liquidity sweeps, and FVG entries produces high-probability setups that align with smart money principles.
Structure before concepts
Emphasizes that without reading structure, all other smart money concepts become harder to apply.
01:32Time frame rule
A clear, actionable rule: never define the trading range on the same time frame as entries.
08:05CRT definition
Introduces the core idea that each candlestick is a trading range with liquidity at its extremes.
10:25NY session confluence
Provides a practical, time-based edge by aligning CRT with the New York session's natural behavior.
14:04Risk-free trade management
A concrete method to protect capital by taking partial profits at 1:1, a key risk management principle.
17:28[00:00] Understanding market structure and liquidity is one of the most important skills a trader must develop to survive and stay consistent in the markets. When context is misunderstood, the market will constantly trap you, no matter how good your entries may look.
[00:15] That is exactly why, in today’s video, we are breaking down how to read market structure correctly, how to define the trading range where liquidity is forming, and how to execute with precision using Candle Range Theory. By the end of this video, you will understand how price is
[00:31] delivered, where liquidity is targeted, and how to trade with structure instead of guesswork. So, if this kind of content helps you, take a second to like the video, subscribe, and turn on notifications so the next lessons reach you the moment they go live. And feel
[00:47] free to share in the comments which topics you would like us to explore in future videos. And if you want to support the channel on a deeper level, consider becoming a member to unlock exclusive content and help keep these lessons coming.
[01:02] You'll also find links to our trusted partners in the description below. Using them costs you nothing, and it directly helps the channel keep producing free educational content like this.
[01:16] Before looking for entries, liquidity sweeps, order blocks, fair value gaps, or any advanced smart money concept, you first need to understand market structure. If you cannot read structure correctly, every other concept becomes harder to apply.
[01:32] At its core, price usually moves through three conditions: uptrend, downtrend, or consolidation. So before marking zones, choosing a bias, or planning an entry,
[01:44] Once this foundation is clear, it becomes much easier to separate clean structure from noise, real continuation from retracement, and valid reversals from simple internal movements.
[01:59] So, let’s begin with the foundation. First, consider an idealized version of market structure: a perfect uptrend. I call this idealized because it is rare to see an uptrend in real market conditions that follows this pattern perfectly.
[02:14] Nevertheless, to enhance our understanding of uptrends, let's examine this ideal model before shifting our focus to the more realistic uptrend structures that are more commonly observed.
[02:28] In a typical uptrend, prices will consistently create higher highs and higher lows. The pattern generally sees prices surpassing previous highs while sustaining the lows. An uptrend concludes when there is a break below one of the significant lows.
[02:44] To preserve the continuity of an uptrend, it is essential that these major lows remain unbroken. Additionally, when a price exceeds a major high, it results in a structural break and forms a demand zone, indicative of a break of structure, or BOS.
[03:00] Accurately identifying major highs and lows is crucial because it allows us to recognize signals for potential trend reversals or continuations. Without correctly pinpointing these key points,
[03:12] traders are at risk of misinterpreting market signals and potentially entering trades on the wrong side of the market. These principles are equally applicable in bearish scenarios. During downtrends, prices consistently form a sequence of lower lows and lower highs. In such scenarios,
[03:29] prices tend to break below previous lows while still respecting the previous highs. Let's explore the details of a realistic market structure, focusing on the more commonly observed uptrend patterns in the market. Consider a scenario where the price surpasses previous highs,
[03:45] breaking upward. At this juncture, a key question emerges: how do we pinpoint valid major highs and lows? To address this, let's examine the left side of the market structure.
[03:57] It is evident that the price underwent an upward trajectory until it began to retrace. The peak reached before this retracement is deemed the major high. Conversely, the lowest point during the bullish wave that triggered this upward movement and led to a break of structure and
[04:13] a new high is recognized as the major low. These two points are the critical external structures of the market, and any structure that develops between them is considered an internal structure. When the price surpasses the major high, marking a break of structure (BOS), it indicates a
[04:30] continuation of the upward trend. On the other hand, if the price drops below the major low, this should be interpreted as a signal of a trend reversal. The internal price actions within these
[04:42] external structures are secondary, provided the price stays above the most recent major low. Maintaining this condition signals that the market remains in a bullish phase. You might wonder why this low at the extreme is treated as the major low.
[04:57] The reason is that it represents the ultimate low point before the price starts its upward trajectory. This particular point is essential as it is the pivotal low that catalyzed the upward movement and the subsequent break of structure.
[05:11] which mirrors the bullish scenario, the bearish wave begins, leading to a structural break. We also identify a major low, marking the lowest point reached after the structural break.
[05:26] These two points, the major high and low, act as our external structures, while all structures developed between them are viewed as internal. Should the price break these major lows downward, it signals a continuation of the trend as illustrated here. Conversely,
[05:42] if the price climbs above the major high, this would be indicative of a potential trend reversal. In simpler terms, the internal price actions within these external boundaries are secondary,
[05:54] as long as the price remains below the most recent major high, signaling a bearish market. As the price retraces upward, it establishes a series of internal highs and lows within
[06:07] our defined trading range, yet it eventually ascends, breaking the recent major low downward. This internal high, situated at the extreme, is now recognized as the new major high because
[06:20] it marks the highest point reached before the price initiated a strong bearish push, resulting in another structural break. Following this, the price undergoes another retracement, forming another major low. After establishing various internal structures,
[06:36] the price sustains its downward momentum, creating a sequence of lower lows and lower highs. Now that we have clearly defined market direction and understand when price is trending or consolidating, the next step is to establish one critical piece of context.
[06:53] We need to understand where price is currently operating and where liquidity is forming. The starting point is simple. Before focusing on entries or execution,
[07:06] you must first identify the current trading range. So what exactly is a trading range? It is not just a box on the chart or a period of consolidation. A trading range represents the area where price
[07:18] is actively delivering and where liquidity is being built. In simple terms, this zone provides the clearest insight into where price is most likely to react once it moves above or below it. And while price remains inside this range, close attention to price behavior is essential.
[07:35] So how do we correctly identify the current trading range? The first step is to zoom out to at least one or two higher time frames compared to your execution time frame. For example, if you execute trades on the 1 minute chart,
[07:48] your trading range should be defined on the 15 minute chart. If you trade on the 5 minute chart, look to the 15 minute, 30 minute, or 1 hour charts. And if your execution time frame is the 1 hour, then your trading range should come from the 4 hour or the daily chart.
[08:05] This rule is critical. Never define your trading range on the same time frame you use for entries. To establish a valid trading range, we begin by identifying the most recent confirmed impulse leg that produced a clear break in market structure. In this example, the break of structure is
[08:21] considered valid because before price continued higher, it retraced into the discount zone, trading below the 50 percent Fibonacci level and allowing resting buy orders to be filled. From there, our focus shifts to the impulsive expansion leg that followed
[08:37] Later, when price moves below the most recent internal low formed in the premium area, which acts as inducement, two confirmations occur at the same time. First, the bullish expansion
[08:51] leg is completed. Second, this swing high now defines the upper boundary of the trading range. This sequence is what allows us to classify the range as valid. to the swing high as the trading range. The reason is straightforward.
[09:10] When we apply the Fibonacci tool from the swing low to the swing high, we can see that price never retraced to the 50 percent level of that impulse. This tells us that discounted buy orders were never filled. As a result, this move does not qualify as a true break of structure.
[09:26] The breakout is incomplete, and the range formed from it cannot be trusted. In this situation, the pullback is simply a temporary pause while price prepares to complete its true impulse leg. For a trading range to be considered valid, price must break below the
[09:42] most recent internal swing low, which serves as inducement and confirms that the bullish expansion phase has ended. Only then do we have a legitimate trading range that provides reliable information.
[09:54] Once the trading range is clearly defined, execution becomes far more precise. Instead of chasing breakouts or trying to predict direction, we wait for confirmation. Liquidity sweeps, inducement, and shifts in price delivery now have real context, because we understand the
[10:10] environment where price is operating. This is where high probability execution truly begins. At this point, the next step is to zoom in. We move from defining the environment to executing within it. This is where Candle Range Theory comes in.
[10:25] So traders, what exactly is Candle Range Theory? Candle Range Theory, or CRT, is a trading concept built around a simple idea. Every single candlestick represents a complete trading range, defined by its high and its low.
[10:42] When you break that candle down into lower time frames, you will notice that its high and low often act as turning points. That is not random. Those levels mark where liquidity forms. In practice, those turning points become key liquidity levels
[10:57] because they represent the highest and lowest price traded during that period. That period could be a day, a week, or even a one minute candle. In other words, CRT is not about predicting random reversals. It is about understanding how price reacts
[11:12] to clearly defined liquidity boundaries inside a single candle. With that foundation, we can combine this structure with smart money concepts to build high probability opportunities. Now, in its classic form, CRT works with three candles, and each one has a specific role.
[11:30] The first candle defines the range. The second candle creates the sweep. The third candle provides the entry. Let’s break that down step by step. Starting with the first candle, its high and low act as the primary liquidity levels that future
[11:46] price will often target. Since those levels represent the extremes of that trading period, they naturally attract orders and stop placements. the high and the low represent the absolute highest and lowest prices traded that day.
[12:02] That alone shows how significant those levels are. Even without analyzing lower time frames, we can identify important liquidity areas just by observing a single candle. The upper boundary is called the Candle Range High, or CRH. In Smart Money terms,
[12:18] the liquidity resting above this level is known as buy side liquidity, or BSL, because it contains stop losses from short sellers and breakout buy orders. The lower boundary is called the Candle Range Low, or CRL. In the same way,
[12:35] the liquidity resting below this level is referred to as sell side liquidity, or SSL, since it includes stop losses from long positions and sell stop orders. This concept can be applied to any candle on any time frame.
[12:49] Now, when the second candle moves above the CRH and then quickly returns inside the range, that movement is called a liquidity sweep. In many cases, once liquidity is taken on one side,
[13:04] price will rotate toward the opposite side of the range. The same logic applies in reverse. If price sweeps below the CRL and closes back inside the range, it often seeks the liquidity resting near the Candle Range High.
[13:18] However, there is an important condition. If the second candle closes decisively above the CRH, the CRT setup becomes invalid. In that scenario, the market is expanding, not rejecting the range.
[13:32] But when the second candle fails to close above the Candle Range High and instead returns inside the range, we can then look to the third candle for a potential short setup, with the Candle Range Low serving as the logical objective.
[13:47] That covers the core idea and the reasoning behind Candle Range Theory. Now, let’s move to the concrete rules and break down how to trade it step by step on the chart. which candle should you choose when applying the Candle Range Theory?
[14:04] If you’ve explored this concept before, you’ve probably seen that one of the most common methods among traders is to focus on the 1-hour candle formed right before the New York session opens.
[14:16] Why? Because the New York session often produces strong reversals, especially shortly after the open. It typically begins by sweeping liquidity built up during the London session and then shifting direction. This behavior creates excellent trading opportunities.
[14:34] So, here’s a smart and structured approach: apply the CRT model to the 1-hour candle immediately before the New York open. If price sweeps liquidity outside that candle’s range
[14:46] and then reenters it, you’re seeing a setup that aligns with both CRT principles and the natural characteristics of the New York session. This confluence often produces high-probability setups,
[14:58] provided you time your entries accurately and manage risk properly. trading against the prevailing trend. Trading in the direction
[15:10] of the trend gives more confidence and consistency in high-probability setups. So, is it possible to use CRT while staying aligned with the trend? The answer is yes. There’s a refined version of this model
[15:24] that applies CRT logic within trending conditions. Let’s break it down. First, identify a market that’s clearly trending up or down. Then, wait for a corrective move,
[15:36] because corrections provide both better entry prices and safer stop loss placement. For example, if the last impulsive move started from this point and pushed all the way up to here,
[15:49] From that point, we apply the CRT model only to bearish candles. Since the overall trend is bullish, we mark the high and low of each bearish candle and observe how the next candle reacts.
[16:06] If the next candle breaks below and closes outside the range, the setup becomes invalid and we move on. Then, we repeat the process with the next bearish candle.
[16:18] This continues until we find a candle that sweeps below its low but closes back inside its range. That’s when we have a valid CRT setup.
[16:30] At that point, we’ve identified both the range and the sweep. Now, the next question is: where exactly do we enter the trade? A simple approach is to open a buy position immediately after the sweep candle closes.
[16:46] But there’s a more refined and higher-precision method. We can zoom into a lower time frame to locate a more accurate entry point. For example, if we’re analyzing the 1-hour chart, we can drop
[17:00] down to the 5-minute or 15-minute chart to see what’s really happening inside that move. On the lower time frame, more structural details become visible. In this strategy, we use the fair
[17:15] value gaps that appear right after the sweep as our entry zones. All we need to do is wait for a fair value gap to form following the sweep, and then place a buy order within that zone.
[17:28] Our stop loss goes just below the gap. For trade management, we can make the position risk-free by taking partial profits when the trade reaches a 1:1 risk-to-reward ratio.
[17:41] This way, even if the market later reverses and hits the stop loss, we keep our capital protected. For the remaining portion, we let profits run until price reaches a major structure level ahead.
[17:55] this combination of CRT logic and fair value gap entries offers a smart and efficient way to trade Candle Range Theory — this time fully aligned with the market’s direction.
[18:10] but this time we’ll include the concepts of premium and discount. In a downtrend, we don’t want to jump in too early. Instead, we wait for a correction that pulls price back into a premium zone.
[18:26] This gives us a better short entry and increases the probability of a successful trade. we apply the CRT model — but now we focus only on bullish candles within the correction. As before,
[18:42] we mark the high and low of each bullish candle and observe how the next candle reacts. If the next candle breaks and closes above the range, the setup is invalid.
[18:54] But if it sweeps above the high and then closes back inside the range, we have a valid CRT signal aligned with the bearish trend. To refine the entry, we drop to a lower time frame and look for a fair value gap that forms right
[19:09] after the sweep. That’s where we place our sell order, setting the stop loss just above the gap. We take partial profit at a 1:1 risk-to-reward level, making the trade risk-free,
[19:23] and let the remaining position run toward the next key support or liquidity area. By waiting for a retracement into a premium zone before applying the CRT, we bring together three powerful elements: trend direction, liquidity manipulation,
[19:39] and precise entries from premium or discount zones. This combination produces clean, logical, and high-probability setups that align perfectly with smart trading principles.
[19:51] Now that we’ve covered how to apply the Candle Range Theory correctly, let’s take a quick look at some of the most common mistakes traders make — and how to avoid them. One major mistake is trying to use CRT in a choppy or sideways market
[20:07] where there’s no clear direction. CRT performs best in trending conditions where you can clearly identify impulsive and corrective legs. Without that structure, the sweeps lose meaning and produce unreliable signals.
[20:24] Another common error is entering too early. Many traders jump in just because price reverses, but that alone doesn’t confirm a setup. You need to wait for a clear liquidity sweep
[20:37] followed by a confirmed close back inside the candle’s range. Always wait for the candle to close — entering before that can easily trap you if price continues in the same direction.
[20:50] A third frequent issue is ignoring overall market context. Even the cleanest CRT setup can fail if it forms right before major economic news or directly into a strong higher time frame level such as daily support or resistance.
[21:08] Always check the broader structure and key zones before executing a trade. will significantly improve your consistency and reliability when trading CRT setups.
[21:24] Now, in the next section, let’s move on to real chart examples and see how to apply this model in different market conditions. Here we have the Euro–US Dollar pair on the 1-hour chart.
[21:36] We’ll examine each CRT pattern that appears during the backtesting session. Let’s begin. By breaking above this swing high, recent price action confirms that the bulls are currently in
[21:48] control — we’re in an uptrend. That means we’ll focus only on buying opportunities. From here, we’ll apply the CRT model to the bearish candles within this structure
[22:00] to find precise, high-probability entries. Here we have our first pullback candlestick. We start by marking the highest point as the Candle Range High (CRH) and the lowest point as the Candle Range Low (CRL). What we want to see next
[22:18] is simple: price needs to break below the CRL and then close back inside the range. However, if the next candle fully breaks below the CRL and closes outside the range, we skip the setup
[22:32] and wait for the next opportunity. Let’s see how the next candle behaves. As we can see, price dipped below the CRL with a wick but then closed back inside the range. This confirms a valid range and sweep formation, signaling a potential long setup. Based on this,
[22:50] we now expect price to complete the CRT pattern with an upward continuation. But the next question is: where exactly do we enter? To refine the entry, let’s zoom into the 5-minute chart and plan our execution.
[23:07] On the 5-minute chart, we can see much more structural detail. This last impulsive move swept liquidity below the CRL and then closed back inside the range, creating the setup we were waiting for. Now, all we need is to locate
[23:23] a bullish fair value gap that formed right after the sweep to use as our entry zone. Looking closely, we can see that a fair value gap has already formed and price is starting to react
[23:36] from that area. With that confirmation, everything lines up for a buy entry here, placing our stop loss just below the fair value gap for a safe and logical position. Now, for our targets, as mentioned earlier, we always close half of the position once price
[23:53] reaches a 1:1 risk-to-reward level. This locks in partial profit and makes the trade risk-free. For the remaining half, we let profits run naturally with the trend.
[24:05] Even if you missed this particular trade, notice how many times price created new fair value gaps along the upward move, offering several additional trading opportunities.
[24:17] Let’s continue on the 1-hour chart and look for more setups. Once again, we spot a bearish candle formation where we can apply the CRT model.
[24:29] We mark the high and low, then wait for the next candle to close. Here, we can see another sweep forming. Let’s zoom into the 5-minute chart to refine our entry. On the 5-minute chart, multiple fair value gaps have already formed.
[24:44] We’ll place a buy limit at the lowest fair value gap since it’s located within the discount zone, providing a better risk-to-reward ratio and safer stop-loss placement.
[24:56] We’ll use the same trade management rules as before. Let’s see how it plays out. The trade triggers our buy limit, reaches the first target, but later reverses and hits the stop loss. However, since we secured partial profit at 1:1,
[25:13] the result is a breakeven trade — no loss, and a clean exit. Let’s go back to the 1-hour chart to look for more opportunities. Here again, we identify a large bearish candle suitable for applying the CRT model.
[25:28] The following candle sweeps liquidity below the Candle Range Low, confirming our setup. Once more, we zoom into the lower time frame to plan the entry. With the sweep confirmed on the higher time frame, the only thing we now need to see on
[25:43] the lower time frame is a bullish fair value gap forming — that’s our signal to set the entry. As we move forward, we can see a small FVG appear. We place a buy limit there,
[25:56] this time with a slightly wider stop loss to allow for volatility. Shortly after, another fair value gap forms, so we set a second entry without canceling the first one.
[26:08] This time, both setups align perfectly and deliver strong winning trades. So Trader, if this video brought you more clarity, like it, subscribe, and turn on notifications
[26:20] so the next lessons reach you. And tell me in the comments what you want me to cover next. And if you want to go deeper, you can become a member of the ComLucro Trader Community right here on YouTube. It unlocks exclusive content, early access,
[26:35] and extra tools for your development, while directly supporting the channel. You'll also find our trusted partners linked in the description. Using those links costs you nothing and helps us keep producing this kind of educational content.
[26:48] And remember, the mission of the ComLucro Channel is simple: we help traders build clarity, confidence, and structure, so every decision is made with discipline and intention.
[27:01] Here you'll find complete courses built as a true trading masterclass — liquidity, market structure, higher time frame analysis, and supply and demand, always focused on reading price and executing with a professional mindset.
[27:16] We also cover trading psychology, risk management, and long-term consistency — because trading isn't just about charts. It's about mindset, discipline, and execution over time.
[27:28] Our main courses include Smart Money Concepts, ICT, Technical Analysis, Trading Psychology, and Wyckoff. Alongside that, we share insights from respected traders
[27:40] Thanks for watching — and I'll see you in the next video.
The video opens by stating a common problem (market traps) and agitates it by saying no matter how good entries look, you'll be trapped without context. Then it promises a solution: learning to read structure and trade with precision.
If you struggle with [PROBLEM], no matter how good your [ASPECT] looks, you'll keep failing. In this video, we break down [SOLUTION] so you can [DESIRED OUTCOME].
AI-generated clip ideas for Shorts based on the transcript
Directly addresses a common pain point for traders, promising a solution to a frustrating problem.
▶ Play ClipBreaks down a complex concept into a simple, memorable framework that is highly educational and shareable.
▶ Play ClipProvides a clear, step-by-step method for a crucial skill, appealing to traders looking for actionable advice.
▶ Play ClipIntroduces a specific, catchy trading strategy (CRT) with a simple rule that is easy to understand and test.
▶ Play ClipShows how to adapt a popular strategy to trending markets, offering a refined approach that increases win probability.
▶ Play ClipSnapshot 2026-11-17
Every observation TubeSum recorded, plotted as measured.
The vertical axis starts at 153K, not zero, so later observations stay readable.
Based on 24 observations · last observed Nov 17, 2026 · solid lines connect consecutive measurements (≤2 days apart); dashed lines span days TubeSum did not measure. · vertical axis focused on the observed range (starts at 153K)
Based on 24 observations · last observed Nov 17, 2026 · solid lines connect consecutive measurements (≤2 days apart); dashed lines span days TubeSum did not measure. · vertical axis from zero
Exact daily observations; gaps mean no observation was taken that day.
| Date | Views | Avg views / hour | Channel median |
|---|---|---|---|
| 2026-11-17 | 156,654 | 49.2 | — |
| 2026-11-16 | 156,628 | 49.3 | — |
| 2026-11-15 | 156,516 | 49.8 | — |
| 2026-11-14 | 156,403 | 50.1 | — |
| 2026-11-13 | 156,197 | 50.5 | — |
| 2026-11-12 | 156,120 | 50.8 | — |
| 2026-11-10 | 155,871 | 51.5 | — |
| 2026-11-09 | 155,742 | 51.9 | — |
| 2026-11-08 | 155,597 | 52.2 | — |
| 2026-11-07 | 155,406 | 52.6 | — |
| 2026-11-06 | 155,183 | 53.0 | — |
| 2026-11-05 | 155,083 | 53.4 | — |
| 2026-11-04 | 154,928 | 53.8 | — |
| 2026-11-03 | 154,634 | 54.4 | — |
| 2026-11-02 | 154,568 | 54.5 | — |
| 2026-11-01 | 154,369 | 55.0 | — |
| 2026-10-31 | 154,127 | 55.3 | — |
| 2026-10-30 | 153,942 | 55.7 | — |
| 2026-10-29 | 153,668 | 56.1 | — |
| 2026-10-28 | 153,496 | 56.6 | — |
| 2026-10-27 | 153,348 | 57.0 | — |
| 2026-10-26 | 153,140 | 57.6 | — |
| 2026-10-25 | 152,895 | 58.1 | — |
| 2026-10-24 | 152,765 | 58.4 | — |
Audience reaction — separate from the performance metrics above.