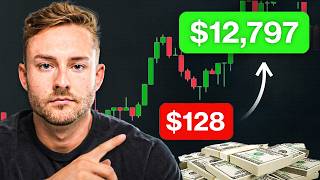
I Made $280K Trading With 43% Win Rate
45sThe shocking contrast between high profits and a losing rate challenges trading myths and immediately grabs attention.
▶ Play Clip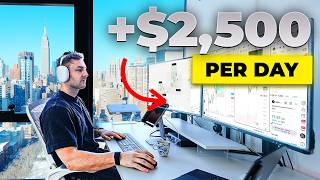
"Delivers a solid framework but oversells the 'full course' with some fluff and self-promotion."
This video presents a comprehensive framework for starting day trading with $100 or less, emphasizing a systematic, repeatable strategy over emotional decision-making. The creator shares a step-by-step process covering market selection, a specific price action strategy, risk management, and scaling through prop firms or leverage, backed by personal results and a 43% win rate.
The creator shares that they have made $280,000 in profit this year while losing more than half of their trades, contrasting with their frustrating start 9 years ago when they lacked a proper plan.
The video outlines a process of starting with $25 risk per trade and scaling up to $2,000 risk, with winning days ranging from $10,000 to $20,000 in profit.
The biggest factor in learning to trade is having a game plan and following it, rather than chasing money immediately. Starting small and scaling only after seeing the process work is ideal.
Trading success is not about being right but about whether the strategy and execution are profitable over time. Professional traders focus on the system, not on feeling good about a correct call.
The first step is picking a market based on monetary goals, capital, and trading schedule. Stocks are liquid but require high capital; futures offer better leverage; forex is hard to read; crypto is 24/7 with low capital requirements.
For stocks, risking $150 requires about $16,000 in capital with 2x margin. Futures require around $1,000 for similar risk. Crypto with 100x leverage can reduce capital requirement to around $300.
Prop firms provide simulated capital (e.g., $100K) for a fee, with rules and profit targets, while leverage allows trading with a small account but increases liquidation risk. The creator prefers cash accounts with leverage for scaling.
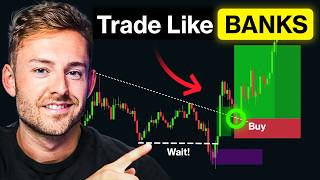
The first step in the strategy is identifying a 'change of character'—a break above a lower high in a downtrend, signaling a potential trend reversal.
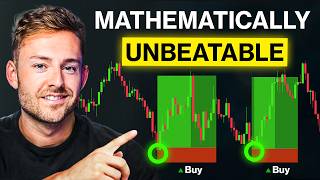
A fair value gap is a three-candle sequence where the first candle's wick high doesn't overlap with the third candle's wick low, leaving a momentum area that price often retraces into before continuing.
Entry is taken at the 50% midpoint of the fair value gap, with a stop loss placed below the most recent swing low or critical point.
After entry, risk is reduced to break even when price closes above a swing high, and targets are set between 1:3 and 1:4 times risk, allowing winners to run for larger multiples.
With a 1:3 risk-reward, a win rate of just 30% can be profitable. The focus is on expectancy, not on being right, which helps avoid emotional trading.
The creator shows real chart examples using the IT Foundation indicator on TradingView, highlighting how to spot fair value gaps and execute the strategy around the 9:30 market open.
Using 15-minute fair value gaps as confluences can improve win rates and allow for larger targets, sometimes extracting 5R, 6R, or even 18R on a trade.
The scaling process involves four pillars: learning the strategy, testing it in a simulated environment (at least 30-100 trades), performing with small risk, and then scaling up using percentage-based risk.
Tracking the maximum consecutive losses (e.g., 5) helps design initial position sizing to survive losing streaks.
The creator uses a Notion journal to track trades, wins/losses, and R multiples, enabling analysis and improvement before risking real money.
Instead of jumping risk amounts, use a percentage of the account (e.g., 2%) to scale risk gradually, avoiding emotional overload and allowing compounding growth.
With $100 risk per trade, a good week might yield $410, scaling to $1,200/month. Risking $200-300 per trade can lead to $3,000-5,000/month.
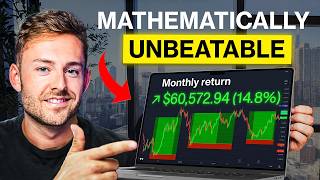
In September, risking $2,000 per trade yielded $60,000 profit; the same performance with $150 risk would be $4,500, showing the framework scales with account size.
The video provides a complete, systematic approach to day trading with small capital, emphasizing process, risk management, and scaling. By following the four pillars and using percentage-based risk, traders can build a profitable system that works across account sizes.
Profitability Over Being Right
Emphasizes that trading success is about system profitability, not being right, which is a core principle for beginners.
02:00Prop Firms vs Leverage
Explains two practical ways to access capital with small accounts, crucial for starting with $100.
08:43Expectancy Table
Shows that a 30% win rate can be profitable with proper risk-reward, challenging the common misconception of needing high win rates.
16:02Percentage Scaling
Provides a systematic way to scale risk without emotional overload, a key to long-term consistency.
26:27September Profit Example
Demonstrates the scalability of the framework with real numbers, showing how risk size directly impacts profit.
28:00[00:02] so far, that's added up to $280,000 in profit so far this year. And this is while losing more than half of my trades. However, 9 years ago when I started, it looked nothing like this. I was frustrated, losing money, and
[00:15] wasting thousands of hours of time because I didn't have a proper plan. And trading completely differently and built a simple, repeatable system, started with small risk around $25 per trade, and worked on scaling that up once I
[00:29] video, I'm going to walk you through the complete process that I followed starting with that $25 risk to now be able to risk $2,000 per trade and have my winning days anywhere [music] from 10 to $20,000 in profit. So, whether you're
[00:42] working full-time, you're in school, or you're already going full in on trading, this is the fastest way that I know to start trading with $100 without wasting a bunch of money and time the way I did. Okay, so let's get into it. Okay, so
[00:54] within 1 to 2 hours per day, I'm going to show you exactly how to start trading with only $100 or less. And before we hop into strategy or anything else, the biggest thing to remember is having a game plan and actually following it is
[01:07] you're learning to trade. So, we're going to go over, first off, what bunch of different options in the market, whether it's futures, crypto, forex, options. Then we're going to go into a simple, repeatable trading
[01:21] strategy, and I'm going to show you the framework of exactly what I use each day so you can look at it, get proof of concept, and understand it. And then, we're going to get into the actual game plan of how to start small and how to
[01:33] systematically increase that to be able to scale up to your actual dollar amount goal. Okay, a lot of people chase money right away in this process, and that's do. It's actually ideal to start small and only add fuel to the fire once you
[01:47] see the process working. Okay, and this process I've deployed over the past 4 to now, year to date, this is what I've been able to do with that. Like I said, with a 43% win rate. Okay, and something with this
[02:00] to remember about trading is that it really has nothing to do with being right and feeling good that your call worked. The only thing that matters is whether or not the strategy and your execution is profitable over time.
[02:12] you feel good that you were right about a trade. Professional traders don't think like that at all. It all comes down to two things inside of system and understand that very clearly. Okay, because in the beginning when I started
[02:25] this process, this looked nothing like my trading. It was very, very different. I would have loss after loss. I would be afraid when I was actually in profit, so I'd start taking trades off too soon and I was doing all of the wrong things that
[02:38] was holding me back until I had this exact strategy of scaling and treating going to share with you. I'm going to show you what I would do if I could start completely from zero over again and how I would actually start this
[02:51] process to be able to scale up to this point of where I am right now. Okay, and get-rich-quick scheme. This is not something that's going to happen overnight, but setting the right foundation makes it actually worth it to
[03:03] consistent. Whereas if you're [music] completely doing the wrong things, it's even know if you're on the right path. path and then the hard work pretty much comes down to you. So, let's start off
[03:16] with step number one, which is picking a market to trade. Okay, now different goal is to figure out based off of your monetary goals, how much capital you have starting to trade and when you plan on trading, which market is going to
[03:29] align well with that. Okay, so if we look at the stock market, the pros are it's a very liquid market, very well regulated and easy to understand why the market moves around. However, there's a high capital requirement, meaning you
[03:41] need a significant amount of money to be able to trade stocks effectively because they have limited leverage and also have limited hours between 9:30 and 4:00 Eastern time for you to be able to trade the stock market. Futures, however, is
[03:54] very similar to stocks, has substantially better leverage, has you to be able to trade on a more flexible schedule. And some of the only cons are it's not ideal for long-term holding, and you are somewhat limited to
[04:07] the instruments that you want to trade. Forex also has a lot better market open you want to trade. So, you can start with a pretty small amount of money. However, with Forex, personally, I find it very hard to read because the global
[04:20] around so much. The price action is very inconsistent and volatile, which can And then you have crypto. Crypto is a 24/7 market, requires low capital threshold to start up, where you can trade or hold long-term. Okay? The only
[04:35] con is you need to know the proper way to actually be able to get access to this video. Okay? And the reason that figuring out sizing is important is our positions. Okay? So, looking at example of a trade that I took, I was
[04:50] able to position myself here, set up a contained amount of risk, and then a calculated amount of profit. And in about 1.5 hours, I was able to realize this amount of profit risking $2,000, which proves that these movements in the
[05:04] market are not random if you know what you're looking for. But we still need to be able to take those ideas [music] and put them into a sound framework that is going to allow us to be consistent and treat this like a business. Okay? So, to
[05:16] we're going to use stocks, futures, or crypto. Okay? So, the question we need to ask ourselves is how much capital do we need for each, and how much are we looking to make from each as well. Okay? So, in order to make this decision, you
[05:29] need to understand how we're figuring out the capital requirements behind each trade. Okay? So, let's take a look at an example of required capital for stocks. So, say we're placing an entry here at 6480. We have our stop loss at 64.5 and
[05:43] take profit at 66. If we want to risk roughly our $100 per trade, 150, we need to figure out how many units to enter with if we're putting our stop level here where we're willingly exiting the trade if it goes against us, and where
[05:57] we're entering. And if we were to subtract those two amounts and divide by subtract those two amounts and divide by our $150 worth of desired risk, that's shares that we're going to have to purchase at our entry price. And in this
[06:10] case, in order to risk our $500, the notional capital requirement is going to be 32,000. Okay, in some brokers where you're actually trading and executing called margin, so they'll give you around 2x margin, which is still going
[06:25] to pretty much leave you needing $16,000 of your own capital to attempt to make $600 in profit while risking that 100-150 dollars on the trade. So, a large capital requirement in order to start up this process. Okay, and if we
[06:39] look at futures, it's operating a little bit differently because we're operating with contracts. Okay, so each contract that you hold gives you a certain fixed dollar amount per point. So, say we have our entry and then we have our stop loss
[06:51] and that's a three-point difference. If we hold one contract with $5 of risk per point, that's going to give us $15 worth of risk, which in this case means we need to operate 10 contracts in order to risk about $150 on our position. And
[07:06] most brokers require at least $50 worth of margin per contract that you're trade on, you'll see now the capital requirement is going to be say around a thousand dollars. This is substantially cheaper and gives us more buying power
[07:20] than if we're trading with stocks. Okay, looking at crypto in the same example, say we want to risk $150, we have our entry minus our stop loss value. Okay, we still need that 500 unit amount. Okay, but with crypto, you can use
[07:32] something called leverage where you can go to 10x leverage or 100x leverage where is going to allow you to effectively use their capital. So, even if the notional value of the position costs 32,000, if we're using 100 X
[07:45] leverage, the capital requirement for that position is now divided by 100 and only requires around $300. So, even if we wanted to risk, say, $25 per trade, we could well be able to do this using leverage with a couple hundred dollars
[08:00] dollars to be able to [music] do this. Okay, so for example, if we look at one of my trades, you can see the notional value is about $950,000. Okay, but you see the actual cost is around $39,000.
[08:13] a substantially larger amount of capital. This trade I was aiming for 6 to 7,000 dollars in profit. So, if you need that $39,000 and say you were risking $20 per trade versus 2,000, that same trade would have costed about $390
[08:29] of actual capital. This is how you're able to start small. This is why I like to trade crypto. So, you can effectively start with risking something like $15 in order to make $60 and the capital requirement is going to be $32
[08:43] of your own capital, which easily allows you to start with that hundred $200 the next thing that we need to know is how to actually get access to this that we can do this. The first is going to be through prop firm. And
[08:59] effectively, what a prop firm is is it's allowing you to use simulated capital where they give you, say for example, $100,000 of theoretical size. You're not using any leverage on this. So, this is the actual size of your account. You
[09:12] the actual size of your account. You pay, say, between 80 and $150 to be able to use that 100K, and they set up rules that you have to follow. So, for example, if you start with 100,000, say you can't lose $3,000 before you're able
[09:25] to make $6,000 in profit. If you're able to systematically consistently earn $6,000 in profit, the money that you make past that point, the firm now has to credit so long as you're inside of those rules, and you can request them to
[09:39] actually send you payouts where they pay you the profit that you earn over that. That allows you to not need your own upfront capital, and the only risk to you is pretty much the cost of actually buying that account and then going
[09:51] of our trading team, this is what a lot of our traders are using to be able to to earn these payouts. Okay, and you can pretty quickly. For example, one of our private team traders 3 weeks in got his
[10:05] profit that he now makes off of that he can start pulling profit out and actually paying himself. Okay, the second option is using leverage. Now, Say Say for example, you put $200 into an account and you use 50x leverage.
[10:19] That's going to allow you to take positions with a notional value of say $10,000, and now you don't have to follow any consistency rules or profit targets. Any money that you make immediately, you can now withdraw and
[10:32] pay yourself. However, there's increased risk with that because as you start to use more and more leverage, your account needs to go down a lot less in order for you to lose that entire amount. Okay, so say for example, you're using 2x
[10:44] leverage. Now, you only need a 50% drop in your capital to lose the entire thing. Say you use 4x leverage, you only need a 25% drawdown in order to liquidate your entire position. And whatever you put into that account is
[10:57] amount of capital that you could potentially lose. Okay, so there's tradeoffs with both. I personally like to trade cash accounts with leverage consistency rules, and I've been able to scale my capital up to the point where I
[11:10] capital in in order to be able to facilitate these trades. But starting off, this prop firm method, because it keeps that risk contained and gets you used to having risk on the table, is super beneficial. Okay, in the
[11:23] description, I put access to what I trade on, both exchanges and prop firms, so you can check both of those out below. Moving into step number two, now approach as far as capital requirements, I'm going to show you the framework to
[11:36] my simple repeatable strategy that I've been deploying for the entire year of 2026. Okay, keep in mind this is going to be a framework and my goal with doing these YouTube videos is to give the framework to prove to you and give you a
[11:48] foundation of what works while still being able to be fair to the private all of the data analysis, have proprietary indicators and things that we look at that significantly increase the win rate where I'm trading it live
[12:01] the next level, but I always want to make sure that I'm providing value here is going to be the framework. Okay, in the first step of the framework that I like to look for is finding the first what's called change of character of the
[12:15] confused with any of this terminology, I'm I'm going to add a card at the end lot of these general concepts that I'm referring to. Just try to absorb as much of this information as you can right now and if you're still confused at the end,
[12:29] all of this together a lot better. But, basically what a change of character is is if we have our trend where we have a lower low, lower high, lower low, lower high, lower low, and then we have price breaking above one of these lower highs,
[12:43] this is the first indication of a new trend direction. So, you can see in this chart example, we have price pushing down putting in a new low down here and then we have a candle close above this high. Now, each one of these candles is
[12:55] on a one-minute time frame and it's showing us the net change over that period. For these black candles, this is the open, the close, the high and the low, and then for a white candle or a bullish candle, this is the open, this
[13:08] the low. So, white candles are showing us a net gain over time and the black candles are showing us a net loss over that one-minute period. So, when we see a candle fully develop that's closing over one of these lower highs, which
[13:23] gives us that change of character. So, right at 9:30, I'm looking for these going to show you chart examples after we go over the model here, okay? The next thing that I'm looking for is something called a fair value gap. Now,
[13:36] a fair value gap is pretty much where the market starts to get momentum, and then as that momentum starts to temporarily die off, this momentum area left behind an area where this three candle sequence's first wick high
[13:49] doesn't overlap with the third candle's wick low, and inside of that leaves behind that fair value gap. And typically what will happen is as the momentum temporarily dies, price will pull into this fair value gap and
[14:02] determine whether or not that momentum was justified, and typically will retrace into the inside of these gaps before continuing to move in that direction if it is going to confirm. So, it's either going to fail, or most of
[14:14] this key area and continue. So, we can use these as hotspots to be able to start positioning ourselves into the market, okay? So, we need to see that value gap. Okay, in step three, what I'm waiting for is to actually position
[14:28] waiting for is to actually position myself into the 50% midpoint of that gap for my entry, okay? So, you can see I'm setting up my entry to go here. My stop loss is going to go underneath the most recent swing low or critical point on
[14:41] the nuance comes into it where it requires some practice, but I'm looking to take that entry right at that 50% midpoint, okay? And step number four is going to be how I'm actually going to be managing this position, okay? So, after
[14:53] I have my entry here, thing that I'm waiting for is taking this swing point before a pull down into my entry. Whenever price is going to make another close above this high, which you can see right here, that is where I'm going to
[15:06] be reducing my risk on my position to break even. And then all I'm doing from there is targeting between one to three and one to four times the amount of risk that I have on the trade. So, for example, if this is my one unit of risk,
[15:19] say in this case it's $25, I'm targeting four times that amount, which would give me $100 in profit and the ability for me to be able to reduce risk to zero once I start to get a move in my direction. Okay, and the goal with this, as you're
[15:33] really want to allow these trades to run. Because we're going to be right a lot less, usually around 30 to 40%, when we are right, we need to make sure that we're extracting five, [music] six, 10, 15 times what we're risking on the trade
[15:48] Okay, and there's different ways we can go about trailing this, but starting as a rule of thumb for me is always that one to three, one to four amount in order to keep me in the profit. Okay, because again, we're not looking to be
[16:02] right call on the chart. It all comes down to looking at profitability through the lens of this table. So, up top we have here our winning percentage, the amount of times that we are winning the trade versus losing, and then how much
[16:16] we're subsequently making on those winning trades. By risking one unit of risk, that's a one to one risk reward. So, $25 of risk for $25 of potential profit. Okay, $50 worth of profit for $25 of risk, $75 in profit for $25 risk,
[16:32] five. Pretty much as far as we want to go, all the way down. So, these are our risk reward amounts. So, say for example, whenever we risk $25, on average, we're making $75 in profit. That means as soon as we cross into this
[16:47] threshold of winning 30% of our trades, that is going to put us into this profitable stage here. Okay, so imagine, you're losing 70% of the trades that you're losing seven of them and you're wrong about seven of the directions, but
[17:01] other side. That's what happens when you start looking at something called expectancy, which is what this is. Okay, if you're just going off of wanting to about the trade that you predicted, that's going to lead you into trouble
[17:14] your feelings or your emotion. And that's one of the biggest things to this strategy in that example that I just showed you, if we're making between 1 to 3 and 1 to 4, we only need to be right about picking those areas between
[17:27] 30 and 40% of the time in order for us to be extremely [music] profitable with of these trades that I'm taking, I'm getting 10 units of risk sometimes, which is going to add to boosting this average risk reward even if my winning
[17:41] percentage is still staying between those 30 and 40%. Okay, so now let's look at a few of these examples recently. Okay, and so what you'll see here that is showing me where the New
[17:54] York Stock Market is opening, as well as I have these fair value gap markers already automatically drawn on my chart. If you want access to this directly on the tools, and you're going to go ahead and add something called the IT
[18:06] Foundation indicator where you can customize all of these inputs and add able to have a chart that looks something like this. Okay, so once you chart, really what I'm doing is looking for this 8:00 a.m. start to the day, and
[18:19] I'm expecting for increased volatility as that 9:30 mark starts to happen. I'm waiting to see happen is for price to put in a higher high, higher low, higher high, higher low, higher high, and then break to create that change of
[18:34] character value. Okay, then I'm finding the midpoint, so that middle point of the fair value gap, setting up my stop loss, placing my position to get at least that 1 to 4 value, and then you'll see if we wanted to risk something like
[18:46] $25, I can set up my entry right at that midpoint, let price trade into it, and you'll see this is often times that last point before the market starts to move comes down to that 1 to 4, and that 1 to 4 level is pretty much just the bare
[19:00] often times what will happen is the market will continue to move down in my direction, and can allow me to get seven times, 10 times, 12 times what I'm risking just by making one single right decision, and then that allows me to
[19:14] average R that I'm getting. Okay, so let's take a look at another example the next day. You can see the market starts to break down. Again, we find that area. Okay, we play this forward into 9:30. This is where we're getting our
[19:27] structural shift. We have our gap here. Okay, we set up the position. Price through that stop loss. So, that's one full loss of $25. Okay, so now we have the same thing in the opposite direction where we have price moving down creating
[19:41] again we find that bullish fair value gap. We would set up our entry here. And you can see that's exactly the key area that price pulls down into and makes an immediate response to the upside. Okay,
[19:53] so at this point this is where I would be reducing my risk to break even once we cross over this threshold. Okay, and you'll see if we're able to really capture these key areas in the session and allow them to trail out, it is not
[20:05] that difficult to get a huge asymmetry in the risk that you're putting on the trade. That combined with being able to reduce risk when we do start to get that first initial move in our direction is exactly how I'm able to keep the losses
[20:18] contained and allow the winners to run and have that disproportionate result by how to read this price [music] action. Now, there's different things that I am positions longer and I'm looking at multiple time frames as what are called
[20:32] confluences. Okay, so for example, if I click on this button here on my TradingView and open up two panes, I can set this to get show me a 15-minute time frame. And what you'll see is if price actually came down and responded off of
[20:45] a bullish 15-minute fair value gap and then immediately had this response off of that zone. And what I've come to find out is if I can aim for these 15-minute fair value gap responses and then take entries that align with that, those are
[20:58] I can scroll out and look to target different fair value gaps which can allow me to extract a lot more than just one to four on these positions. Okay, so for example, if we look at a trade like
[21:11] this, I'm aiming for the response off that higher time frame fair value gap, and then all I'm doing is basically allowing the trade to breathe, gradually moving the take profit up. You can see I'm up 11, 12,000 on this position.
[21:23] trading team, this is what we're also showing to our traders. You can see our team members 5R, 6R, 18R on this trade, which means if they're risking $100, that's $1,800 in profit. Okay, but now that you have the framework, the
[21:37] question is how do we systematically scale this up over time and slowly increase the per trade risk to be able to get to those dollar amount goals that doing this, if I get start from the beginning, this is the exact strategy
[21:51] that I would follow in order to implement my learning, my testing, and scaling my strategy. Okay, because the mistake that most people make when they're starting off is they learn the information and then immediately try to
[22:03] trade it in the live market. In trading, there's no barrier to entry. If you wanted to, you could just take as much money as you want, go directly into the market, and try trading it. Whereas a lot of other professions kind of force
[22:15] prevents you from trying to do something really difficult at the end without the individual, have to discipline yourself to do the same thing in trading. And something called the four pillars. So the first pillar is where you're
[22:30] where you're actually testing [music] this information to have proof of you're performing it in a simulated environment before you get to the end result ever using a single dollar in the
[22:43] at that point, the only thing you're trying to do is figure out the the live market, and you can prevent yourself from wasting a bunch of time, effort, [music] and energy, and money trying to jump directly into the live
[22:57] markets. So for example, step one, we have our strategy, our framework. Okay, not every single thing that I'm looking at, but this is an example of a strategy step two is going to be actually inputting this data and testing it over
[23:11] time to see the result. Okay, so what you want to do is achieve something typically this is going to take at least 30 trades, but I would recommend something closer to 100 trades without ever using a single dollar of risk
[23:25] simulated environment. [music] And all you want to do is execute this strategy over say 100 trades. Say all of these red trades are losses, all of the greens are winners, we can calculate the total amount of R that we would
[23:39] potentially [music] make over this process and start to use that to design our goal and our starting point of how much money we want to risk depending on the second thing that we want to look at is something called losses in
[23:51] succession. What that's going to show us is how many losses we're taking in a row so that we can account for that when we're at designing our initial sizing. Okay, so this example, say we have a 44% win rate. On average when we're making a
[24:04] correct trade, we're making 4 R and the most amount of losses we take in a row is five trades statistically. We can now take this and do this via a journal and have this entire model to then be able to move on to the next steps to base our
[24:17] entire plan on. Okay, so this is a journal that I use in Notion to track available to you guys if you go in the tools in the description. Okay, and what this allows us to do is pretty much input all of the trade information that
[24:30] we're looking to test as well as whether we have wins or losses and our P&L on to sum the amount at the bottom and also show us how many units of risk we're making or losing. And the cool part about this is that we can flip over to
[24:43] our wins and look at all of the winning trades and all of the losing trades and be able to analyze and improve our performance over time before we ever put a single dollar to work in the market. Okay, so by using this replay feature in
[24:56] that journal feature, you're basically enabling yourself to dry run this work before, again, you're moving to the live market and putting money on the table to risk. Okay, so that's going to be your third phase of performing to see
[25:09] how the tests come out, whether or not you executing your process results in time. Okay, once you get to stage number four, this is where you can start with anywhere between, say, 10 and $20 of risk per trade, which in futures and
[25:24] crypto is well feasible by getting access to capital with either prop firms or leverage. And the only thing that you want to do at this point is stay as consistent as possible with your final optimized process to figure out did you
[25:37] stick to the rules? What was your win rate? Your average risk reward? And once positive outcome on this plan. Okay, and what doing this in phases allows you to do is identify where your actual problem
[25:49] is. So, for example, say when you're testing, you have a 44% win rate, performing is 40 two, and then when you go to live, you have a way lower [music] win rate. And say you also have a way lower average amount of R. This is where
[26:02] you can try to identify what behaviors you are directly changing when it comes to putting money on the line, and all you have to do is focus on handling that randomly and you never go through a structured process, it's going to be
[26:15] are and how to improve them. Whereas, followed from the jump because it basically allows you a straight path of improvement. And once you have profitability with that small dollar
[26:27] amount, the key is to use something called percentage scaling, not just the table as risk because that is going realize it or not. I remember jumping from $25 risk to $100 risk, I had to go
[26:41] back to $25 risk because I couldn't emotionally handle it. And what I've realized through that is just using a percentage of your account as your risk per trade allows you to gradually scale up when you're making profit and scale
[26:54] example, if we have a $500 account, we want to risk 2%, which is going to give us that $10 per trade risk. Say if we can make 4R in a week, that's $71 in can make 4R in a week, that's $71 in profit. Now we're adding that $41 into
[27:07] the 500 balance, and then slowly that will work its way up to 1,000, where that 2% will now be $20 of risk per trade, where you're making $82 in a week. And then the same result with a $5,000 account is $400 a week, and so
[27:20] on. And obviously you can inject capital into this process as you're seeing it's working, but this allows you to start relatively small and then be able to Okay, and if we take a look at an example from one of my previous trading
[27:33] weeks, even though I was able to make 8.2K, that was risking $2,000 per position. So, it wasn't even that crazy of a week, but even doing this with $100 worth of risk, executed properly, is $410 a week, about $1,200 a month, and
[27:47] then slowly scaling that up. Okay, so risking 200, 300 dollars per trade is how you start to get to that three to five thousand dollars a month in trading profit if you know exactly how much R you're expected to make over that month,
[28:00] amount by the dollar amount you're trying to make for the month, and that risk in your system per trade to get to that result. So, for example, last month in September, risking $2,000 per trade, I was able to make a little over $60,000
[28:14] I was able to make a little over $60,000 in profit. That with a $150 risk per trade, same exact performance, would be equal to $4,500 in profit. So, you can pretty much apply a framework once you master that
[28:26] framework to [music] any size account, and it's mostly about mastering that process and then adding fuel to the fire and injecting capital once you see proof this is the exact framework that [music] we're focusing on on the private side of
[28:39] trading with the team, and everything that we focus on is always process first, focus on the R, and then let those proxy goals end up delivering the profitability. Okay, if you're still here, make sure you hit the like button
[28:52] on the video. Subscribe to the channel if you want to know when I put other want to learn more about market structure and other concepts, I'll put trading live with us in learning the [music] full in-depth strategies and
[29:06] put a link right here. But, until next time, I will see you [music] all in the time, I will see you [music] all in the next video.
The creator opens with a striking profit figure ($280,000) while admitting a low win rate, creating curiosity about how this is possible and hooking viewers who want to replicate the success.
I made [NUMBER] in profit while losing [PERCENTAGE] of my trades. Here's the exact [SYSTEM] I used to do it, starting with [SMALL AMOUNT].
AI-generated clip ideas for Shorts based on the transcript
The shocking contrast between high profits and a losing rate challenges trading myths and immediately grabs attention.
▶ Play ClipReveals a practical, low-capital way to start trading crypto with 100x leverage, a highly searched topic that offers a quick educational payoff.
▶ Play ClipExplains a popular way to trade with large simulated capital for a small fee, a trend many aspiring traders want to understand.
▶ Play ClipThe counterintuitive idea of profiting with a low win rate intrigues viewers and explains expectancy in a simple, memorable way.
▶ Play ClipA step-by-step visual explanation of a concrete trading strategy appeals to both novices and experienced traders seeking actionable tips.
▶ Play ClipSnapshot 2026-11-18
Every observation TubeSum recorded, plotted as measured.
Based on 23 observations · last observed Nov 18, 2026 · solid lines connect consecutive measurements (≤2 days apart); dashed lines span days TubeSum did not measure. · vertical axis from zero
Exact daily observations; gaps mean no observation was taken that day.
| Date | Views | Avg views / hour | Channel median |
|---|---|---|---|
| 2026-11-18 | 160,166 | 278.5 | 264,879 |
| 2026-11-17 | 157,006 | 289.1 | 264,879 |
| 2026-11-16 | 155,946 | 291.5 | 264,879 |
| 2026-11-15 | 152,818 | 302.6 | 264,879 |
| 2026-11-14 | 149,678 | 312.5 | 264,879 |
| 2026-11-13 | 146,121 | 324.7 | 264,879 |
| 2026-11-12 | 143,442 | 333.6 | 264,879 |
| 2026-11-10 | 135,712 | 355.3 | 264,879 |
| 2026-11-09 | 132,513 | 369.1 | 264,879 |
| 2026-11-08 | 128,819 | 382.3 | 264,879 |
| 2026-11-07 | 124,961 | 398.0 | 264,879 |
| 2026-11-06 | 120,543 | 421.5 | 264,879 |
| 2026-11-05 | 117,203 | 447.3 | 264,879 |
| 2026-11-04 | 113,127 | 475.3 | 194,564 |
| 2026-11-03 | 108,219 | 530.5 | 194,564 |
| 2026-11-02 | 105,680 | 556.2 | 194,564 |
| 2026-11-01 | 100,969 | 601.0 | 194,564 |
| 2026-10-31 | 94,190 | 663.3 | 194,564 |
| 2026-10-30 | 88,159 | 747.1 | 194,564 |
| 2026-10-29 | 79,698 | 847.9 | 194,564 |
| 2026-10-28 | 67,895 | 969.9 | 194,564 |
| 2026-10-27 | 51,206 | 1,113.2 | 194,564 |
| 2026-10-26 | 29,815 | 1,490.8 | — |
Audience reaction — separate from the performance metrics above.