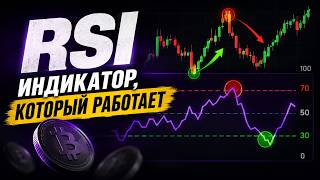

Why RSI Above 70 Doesn't Mean Sell
45sChallenges a common beginner mistake, creating curiosity and relatability.
▶ Play Clip"Title promises a full breakdown and strategy, and the video delivers comprehensive RSI education with practical tips."
This video explains the RSI (Relative Strength Index) indicator, debunking common misconceptions and providing a practical guide for using it in trading. The presenter covers the indicator's logic, correct interpretation of overbought/oversold levels, and advanced signals like divergence, emphasizing that RSI measures the strength of price movement, not future direction.
RSI does not predict price direction; it measures the strength of the current price movement, like how hard the driver presses the gas pedal.
RSI fluctuates between 0 and 100, calculating the ratio of green to red candles over a period. Levels 30 and 70 mark extreme imbalances between buyers and sellers.
Developed by Wells Wilder in 1978, published in his book 'New Concepts in Trading Systems'.
Default period is 14, analyzing the last 14 candles. Beginners should start with 14. Shorter periods (e.g., 3) are faster but noisier; longer periods (e.g., 30) are smoother but lag.
Adding a moving average to RSI helps identify trend direction and potential entry points when the RSI line crosses the MA.
RSI above 70 or below 30 is not a direct buy/sell signal. It indicates caution, not reversal. Price can continue trending while RSI stays in extreme zones.
Wait for RSI to exit the zone: buy when RSI rises back above 30 after being below; sell when RSI falls back below 70 after being above.
RSI above 50 indicates buyer dominance (uptrend); below 50 indicates seller dominance (downtrend). Use as a filter for trade confirmation.
In strong uptrends, RSI often stays between 40-80; in downtrends, between 20-60. Use these adjusted ranges instead of fixed 30/70.
Divergence: price makes higher high but RSI makes lower high, signaling weakening buyers. Convergence: price makes lower low but RSI makes higher low, signaling weakening sellers.
Start with obvious divergences; higher timeframes (4H, daily) give more reliable signals. Avoid over-analyzing.
Trend lines, support/resistance, and patterns (triangle, double top) can be drawn on RSI, sometimes preceding price movements.
Always prioritize higher timeframe RSI readings. If higher timeframe shows overbought, avoid buying on lower timeframe.
Using only RSI signals on Bitcoin over 3 months with 4% take profit and 2% stop loss yielded 14% profit, with fewer entries than MACD.
RSI is a powerful tool for gauging market strength, but it must be used correctly—not as a standalone reversal indicator. Combining RSI with other analysis and focusing on higher timeframes improves trading accuracy.
What does RSI measure?
The strength of the current price movement, not future direction.
00:46
Who developed the RSI indicator and when?
Wells Wilder in June 1978.
02:34
What is the default period for RSI and what does it mean?
14, meaning it analyzes the last 14 candles.
03:24
What do RSI levels 30 and 70 indicate?
Areas where the imbalance between buyers and sellers becomes extreme (oversold and overbought, respectively).
02:22
Why is RSI above 70 not a direct sell signal?
Because price can continue rising while RSI stays above 70; it only indicates strong upward movement, not imminent reversal.
05:25
What is the correct way to use RSI levels 30 and 70 for entry?
Wait for RSI to exit the zone: buy when it rises back above 30 after being below; sell when it falls back below 70 after being above.
06:07
What does RSI level 50 indicate?
If RSI is above 50, buyers dominate (uptrend); if below 50, sellers dominate (downtrend).
07:30
In a strong uptrend, what RSI range is typical?
Between 40 and 80.
08:55
What is divergence in RSI?
When price makes a higher high but RSI makes a lower high, indicating weakening buyer strength.
10:35
What is convergence in RSI?
When price makes a lower low but RSI makes a higher low, indicating weakening seller strength.
11:36
Which timeframes give more reliable RSI signals?
Higher timeframes like 4-hour or daily.
12:33
What is the key rule when using RSI across multiple timeframes?
Always prioritize the higher timeframe reading.
13:45
RSI Measures Strength, Not Direction
Fundamental insight that corrects a common misconception among beginners.
00:46Safe Entry Method: Wait for Zone Exit
Practical technique to avoid premature entries and reduce risk.
06:07Level 50 as Trend Filter
Underused feature that adds confirmation to trade decisions.
07:30Divergence as Powerful Reversal Signal
One of the most reliable RSI signals when used on higher timeframes.
10:35Multi-Timeframe Analysis Priority
Crucial principle to avoid conflicting signals and false entries.
13:45[00:03] Imagine you look at the chart, see that the RSI has risen above 70, which means it is overbought, and you open a short position. And the price continues to rise. You close the stop loss, open a new short and stop again. And in the end you come to
[00:17] the conclusion that this indicator does not work. Sound familiar? Today I will explain why this happens. Let's look at what RSI is, what it actually shows, how to correctly use levels 30 and 70, and I'll show you the main signal that really
[00:33] helps find reversal points. After this video, you will stop guessing and begin to understand the indicator's logic. Let's go.
[00:46] strength index. Many people think that he can predict the future, but this is not true. RSI does not know where the price will go: in an hour, tomorrow or in a week. It shows something completely different. It shows the strength of the current price movement. To make it
[01:01] easier to understand, imagine a car. The price is the car itself, and the RSI does not show the speed of the car, but how hard the driver is currently pressing the gas pedal. If buyers start actively buying up an asset and the price
[01:14] rises rapidly, the RSI value also begins to rise. If sellers begin to dominate and the price drops sharply, then the RSI begins to fall. Therefore, it is more correct to perceive RSI as an indicator of the strength of buyers and sellers.
[01:29] And this is a very important idea, because most beginners think completely differently. They believe that if the RSI has risen high, then the price must necessarily fall, and if the RSI has fallen sharply, then the price
[01:42] has fallen sharply, then the price must necessarily rise. But it's not the same thing. Now let's look at the nature of this indicator. RSI is an oscillator. In simple terms, its line fluctuates within a certain zone. It is limited to a
[01:56] maximum value of 100 and a minimum value of zero. Why exactly so? Because RSI calculates the ratio of green and red candles over a certain period. The stronger the upward price movement and the greater the total length of green
[02:10] candles, the closer the indicator value is to 100. The stronger the decline and the more red candles, the closer the value is to zero. This is why levels 30 and 70
[02:22] are marked. They mark areas where the imbalance between buyers and sellers becomes extreme. But we'll talk about this a little later. By the way, this indicator was not invented by some random person. It was developed by the
[02:34] famous stock trader Wells Wilder. He published the RSI in a journal back in June 1978 . A little later, his book was published, which was called "New Concepts in Trading Systems", in which he explained in detail the
[02:49] essence of the indicator. Now let's install this indicator on the chart. If you use Trading View or trade on the exchange, [music] it's very simple. Click on the Indicators button and enter RSI in the search.
[03:10] relative strength index. We select it and add it to the chart. After this, a separate window with the indicator itself will appear under the price chart. Now pay attention to the settings. By default, a
[03:24] period of 14 is used almost everywhere. If you are just starting to learn trading, I recommend setting this value. It was this period that Wлer proposed. And it is this period that is still used by millionaires and traders around the world. What does
[03:39] this period mean? If the period is set to 14, then the indicator analyzes the last 14 candles. For example, period three will analyze only three candles. The indicator will become very fast, sensitive, but also very noisy. And the
[03:55] period 30 will look at 30 candles. It will become smooth, but will be noticeably late. Periods of 9 and 20 are also popular. Each trader chooses them to suit their needs . But I recommend starting with the classic 14-day period. I also
[04:11] advise turning on the moving average right away . It works on the same principle as all other sliding ones. Shows the direction of the trend and places to open positions at the intersection with the purple line. Now
[04:24] let's move on to the most famous function of RSI: determining overbought and oversold conditions. Many beginners perceive these levels as a direct signal to buy or sell. For example, the RSI rose above 70. That's it, the price is too
[04:39] high. There will definitely be a fall now. And I immediately open a short position. And if the price dropped below thirty, the same thing . That's it, the price is already too cheap, it's time to buy. And they open the womb. If everything were that simple, then absolutely
[04:55] every trader would make money. The market works a little differently. Let's imagine the situation. Bitcoin has risen by 25% in just a few days. News about a new bull market is already appearing on the internet . Everyone starts buying. And at this
[05:09] point, the RSI has long been above 70, somewhere around 85. But the price of Bitcoin continues to rise. Another day passes, Bitcoin adds another 10%, then a few more percent, and so on. But the problem here is not the
[05:25] indicator. The problem is in the misunderstanding of his signal. An RSI above 70 does not mean that the price will definitely reverse. It only shows that the upward movement has become very strong, and that they are pressing hard on the gas pedal. And as long as
[05:38] buyers continue to control the market, the price may well continue to rise, as it has here. The same thing works in reverse. During a strong decline, the RSI may remain below the thirty level for a long time , while the price will
[05:52] continue to decline. Therefore, remember the main rule: RSI above 70 or below 30 is not a signal to trade, it is a signal to be more careful. But how to use these levels correctly? The first method is the safest
[06:07] levels correctly? The first method is the safest for beginners - wait until you leave the zone. If the RSI drops below thirty, I won't buy. I'm waiting for the indicator to rise above thirty again. This means that selling pressure
[06:20] is starting to ease. Only after this do I consider purchasing. If the RSI rises above 70, I, again, am in no hurry to open a short. I'm waiting for the indicator to start declining and cross level 70 from top to bottom. This suggests that
[06:36] buyers are starting to lose strength. Of course, in this case we may miss part of the movement, but, as practice shows, it is better to earn a little less than to open a trade too early and incur a loss. And
[06:50] here I want to give a very important piece of advice. Never try to catch the perfect bottom or the perfect top. This is one of the most common mistakes. Even professionals don't do this. Their task is to enter a trade when
[07:03] the probability of success becomes higher. And the word probability is one of the most important in trading. I often say that we never know for sure where the price will go. We are simply collecting various factors that
[07:16] increase the likelihood of a particular scenario. And RSI is just one of these factors. Not the only one, not the main one, but one of the elements of the overall main one, but one of the elements of the overall picture. Now let's talk about level 50.
[07:30] Most beginners don't pay attention to it, but in vain. This is another very useful feature of RSI that for some reason no one underestimates. If the RSI rises above 50 and begins to hold steady above it, this indicates
[07:44] that buyers are steadily beginning to dominate sellers. The trend is upward. And if the RSI is below level 50, the advantage is on the side of sellers, the trend is downward. How to use this in practice?
[07:59] Let's say you've found a good entry point for a buy, the price is near strong support, or a reversal candlestick pattern has appeared. But you still reversal candlestick pattern has appeared. But you still doubt. Open RSI. And if it has
[08:11] already consolidated above the bird, this is another argument in favor of buying. Well, if all other factors point to growth, and the RSI continues to be significantly below the 50 level, I begin to analyze the market more closely. Sometimes it is better
[08:27] to miss a trade than to enter it without sufficient confirmation. Personally, I very often use this level as an additional filter. If the RSI shows the opposite direction, I wait. And this often
[08:39] saves from false entries. Now I want to tell you about another interesting feature of RSI that not everyone knows. Experienced traders often use not only levels 30 and 70, but also levels 20 and 80. This is why, during a
[08:55] strong uptrend, the RSI rarely falls below level 40, let alone 20. The price is constantly being bought out. Each correction ends quickly. The indicator simply does not have time to drop to the thirty level. As
[09:08] a result, its range of motion is constantly shifting. Instead of the usual levels of 30 and 70, the market begins to live in a range of about 40 and let's imagine a strong bull market. Bitcoin has been breaking new highs for several weeks now
[09:23] , and every small correction is quickly bought out. At such times, the RSI is almost always above forty and often stays around 80. Now let's consider the opposite situation. There is a
[09:37] strong bearish trend in the market. The price gradually declines, and any attempt at growth quickly ends with a new wave of selling. In this situation, the RSI most often moves this situation, the RSI most often moves between 20 and 60. It
[09:52] almost never reaches 70, but constantly bounces down to around 60. And this is very important. If you see that during an uptrend the RSI is constantly around 80 and does not even think of dropping to twenty, this is
[10:07] confirmation of the strength of the trend. And if, during a downward trend, the RSI suddenly breaks through the 80 level, this could be a signal that the trend is starting to change. Conversely, if in an uptrend the RSI suddenly drops to twenty, expect a possible
[10:23] downward reversal. This is why many experienced traders use the experienced traders use the 40-80 range for a bullish market and 20-60 for a bearish market. Now let's move on to the most powerful signal of this indicator. We are talking
[10:35] about divergence and convergence. Many traders consider it to be the strongest signal of this indicator. And not in vain. What is this ? In simple terms, this is a discrepancy between the price and the indicator. Imagine that Bitcoin continues
[10:51] to rise. The price is updating new highs. It would seem that everything is fine, but at this moment the RSI shows a completely different picture. The price rose above the previous maximum, but the RSI, on the contrary, was unable to update its previous maximum.
[11:08] This creates an interesting situation. Price tells us: buyers are getting stronger, but RSI says: "No, in fact, the strength of buyers is already starting to decrease." This discrepancy is called divergence. [music] It's
[11:22] like a car is accelerating and it's running out of gas. In this case, expect a downward reversal. Well, convergence works the other way around. The price makes a new low, and in the RSI this low is higher than the previous one. This
[11:36] means that sellers are losing power. Expect an upward reversal. But there is a very important point here. Convergence and divergence do not mean that the market will reverse right now. These lines simply mean, or rather warn, that the strength of
[11:51] one of the sides is beginning to run out. And, by the way, some practical advice for you on these divergences. If you are just starting to learn trading, do not try to look for divergence on absolutely every chart. Believe me, in a
[12:06] few days it will start to seem to you that it is everywhere. This is a normal mistake for beginners. First, learn to see only the most obvious convergences and divergences, those that literally catch the eye. And only after that
[12:19] move on to more complex situations. One more important point. The older the timeframe, the more reliable these indicators are. On the daily chart they usually have much more significance than on the five-minute time frame. On smaller
[12:33] timeframes, the market moves a little more chaotically; there is significantly more noise. That 's why I personally always trust signals on the four-hour or daily timeframes more. One interesting fact for you. Few people talk about it, but the
[12:48] RSI indicator can be used to plot trend lines, support and resistance levels, and even find graphical patterns. It happens that the figures are not visible on the price chart, but they are clearly visible on the RSI . for example, triangle,
[13:03] double top, head and shoulders or other patterns. And quite often, a breakout of a trend line or level on an indicator can precede a similar movement on the price chart. That is, the presence of a figure on the indicator chart may
[13:17] indicate an upcoming change in the price movement on the chart itself, or its slowing down or acceleration. This is not the most popular way to use RSI, but believe me, it is also something to consider. I myself sometimes use this to
[13:30] further confirm my ideas. It is especially useful when the price chart gives an ambiguous picture, and the RSI provides clarification of the situation. And one more point is the use of RSI on different timeframes. For a more
[13:45] convincing entry into the market based on the RSI indicator values, you should set its readings on different time frames. Imagine the RSI on the fifteen-minute Imagine the RSI on the fifteen-minute chart has dropped to 25. It's oversold,
[13:57] meaning you want to buy, but you open the two-hour chart and see the RSI at 75, which is overbought. So who should we trust here? The answer is simple: always focus on the higher time frame. If the two-hour reading is overbought,
[14:12] the market is in a selling mood. Don't try to buy it in fifteen minutes. This will be a trap. Wait until Tamreim says yes. This approach is called multi-frame analysis. Also, never adjust the analysis to suit your desires.
[14:26] For example, you really want to buy Bitcoin and start looking for any arguments in favor of buying it. RSI, let's say, shows oversold, and you say: "Great, I'll buy." But at the same time, you completely ignore the strong
[14:38] downtrend, negative news and lack of support. This is called biased analysis. You can't do this. Always try to look at the chart as objectively and with a cool head as possible. Now let's find out how many
[14:52] entry points there were using only the RSI indicator. I'll look at all the options for the last 3 months on the Bitcoin chart. Now I'll speed up the video so you don't have to wait. There wo
[15:09] Here I do the same as in the training video about the MACD indicator. Take to profit 4%, stop loss 2%. And, as you can see, there weren't that many entry options. There
[15:21] was much more on the MSD indicator, although the time here is different, this also needs to be taken into account. Overall, the profit was 14%. It turns out that I will put it in second place then. After watching this video, I advise you
[15:37] to find some free time and open the chart of any coin and find 10 situations in it when the RSI went above the 70 level and 10 situations when it fell trades, but just look at what happened after that, where the market
[15:53] actually turned around and where it continued to move. Also find divergence. Look what happened to that price. Also find convergence. These exercises will help you understand the logic behind RSI much better
[16:07] than just studying the theory from videos. I hope this video helped you understand how RSI works. If you found this video helpful, please give it a like. This way, I'll know you're interested in the trading section and I'll
[16:21] release more educational videos like this one. Please comment below the video to let us know if you've ever used RSI and what results it has brought you. If you have any questions, feel free to ask. I try to read the comments under every
[16:34] video and respond to them whenever possible. And, of course, subscribe to the channel are already videos here about support and resistance levels, leverage, risk management, and many other useful videos. The description will also contain
[16:48] links to the crypto exchanges I trade on. These are referral links. By registering through them, you will receive discounts on trading commissions and registration bonuses. Thanks again everyone for watching. Good luck in trading,
[17:00] patience and discipline to everyone. See you in the next video. Bye.
⚡ Saved you 0h 17m reading this? Transcribe any YouTube video for free — no signup needed.