
Spot a Downtrend Like a Pro
43sClear step-by-step visual of trend identification with chart example hooks viewers into learning a core trading skill.
▶ Play Clip"Delivers a concise, practical tip on using the 50 MA, but the title oversells by implying a comprehensive guide when it's a brief tip."
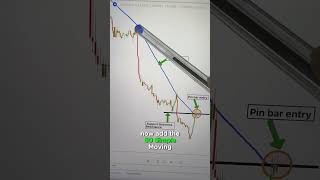
This video demonstrates how to identify and trade a downtrend using price action, support and resistance levels, the 50 simple moving average, and Fibonacci retracement. The presenter emphasizes the importance of confluence—combining multiple technical signals—to confirm entry points and improve trading decisions.
The first step is to identify a clear trend. In the example, the chart shows a downtrend, prompting the trader to look for selling opportunities.
Identify key support and resistance levels. A level that previously acted as support can become resistance once broken, providing a potential entry zone.
Add the 50 simple moving average to the chart. The market was rejected at the resistance level and the 50 MA, marked by a pin candlestick pattern, which is a strong signal.
Add Fibonacci retracement as an additional layer of confirmation. The entry point aligns with the 50% or 61.8% Fibonacci golden ratio, adding extra confluence to the trade.
The video teaches a systematic approach to trading downtrends by combining trend identification, support/resistance, the 50 MA, and Fibonacci levels. The key takeaway is that confluence of multiple technical tools increases the probability of a successful entry.
What is the first step in trading a downtrend according to the video?
Identify a clear trend, such as a downtrend, to look for selling opportunities.
00:02
What happens to a support level when it is broken?
It often becomes a resistance level.
00:16
What candlestick pattern indicates rejection at a resistance level?
A pin candlestick pattern.
00:30
What Fibonacci levels provide extra confluence for entry?
The 50% or 61.8% retracement levels (golden ratio).
00:45
Trend Identification First
Establishes the foundational principle that trend identification precedes any entry decision.
00:02Support Becomes Resistance
A classic technical analysis concept that is crucial for spotting reversal zones.
00:1650 MA as Dynamic Resistance
Shows how a moving average can act as a dynamic resistance level in a downtrend.
00:30Fibonacci Confluence
Demonstrates the power of combining Fibonacci retracement with other levels to increase trade probability.
00:45[00:02] average during trending markets for smart trading decisions the first step is identifying a clear Trend take a look at this chart it's a downtrend as a price action Enthusiast I'm always on the lookout for selling opportunities
[00:16] but the real question is how do you nail the perfect entry during a downtrend first things first identify key support and resistance levels see this level it used to be support and now
[00:30] its resistance now add the 50 simple moving average to your chart see how the market was rejected at this resistance level and the 50 moving average that rejection marked by a pin Candlestick pattern is a strong signal but why stop
[00:45] there let's add another layer of confirmation let's use Fibonacci retracement look at this point it's at the 50% or the 50% or 61.8% Fibonacci golden ratio this extra
[00:59] 61.8% Fibonacci golden ratio this extra confluence

⚡ Saved you 0h 01m reading this? Transcribe any YouTube video for free — no signup needed.