
The 5-Step Strategy That Made Me $10K
48sThe promise of a free, backtested strategy that turns $100 into $10,000 is a high-engagement hook for aspiring traders.
▶ Play Clip"Title promises a guaranteed $100-to-$10,000 path, but the video is a standard supply/demand scalping guide padded with a broker pitch."
The video presents a 5-step trading strategy that the creator claims he personally backtested for 2025. The method is built around the 15-minute timeframe on TradingView and combines trend identification, Gann box discount zones, liquidity levels, and supply/demand zones with strict risk-reward rules. It also includes a mid-video sponsored broker mention.
The presenter shares a free 5-step trading strategy for 2025, claiming it was refined after thousands of backtests.
The strategy requires TradingView, the 15-minute timeframe, and all 5 steps must be followed exactly or the trade "goes up in flames".
A downtrend is defined by lower lows and lower highs; an unclear direction means consolidation and should be avoided entirely.
Use the Gann box tool, keep only levels 0, 0.5, and 1, and uncheck all time levels; mark from the recently broken low to the previous swing high.
In a downtrend, look only for trades in the upper discount zone; the discount area is where price is naturally drawn to.
The creator promotes a broker called AAAfx, highlighting 0% commissions, forex/stocks/crypto, and availability in 176 countries.
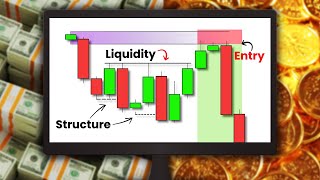
Liquidity is simply a previous high or low; traders place stop losses there, so price often revisits these areas before continuing its main move.
Mark the first candle of a strong move using a rectangle tool — a strong up move creates a demand zone and a strong down move creates a supply zone.
Enter when price is in the supply/demand zone, inside the discount zone, and the trend is confirmed. Set the stop-loss above supply and take profit at the prior low. The example shows a 7.47 reward-to-risk ratio.
Do not take the trade if the reward-to-risk is below 2.5. The long example shows an equivalent process, ending in a winning trade.
Which chart platform and timeframe does this trading strategy use?
TradingView and the 15-minute timeframe.
00:19
What price structure defines a downtrend?
Lower lows and lower highs.
00:50
What should a trader do if the market is consolidating and trend direction is unclear?
Do not trade it and stay away.
01:04
Which values should be checked in the Gann box tool after setup?
Only 0, 0.5, and 1, with all time levels unchecked.
02:01
In a downtrend, where does the strategy say to look for trades?
In the upper discount zone of the Gann box.
02:45
In its simplest form, what is liquidity?
A previous high or low where stop-losses are pooled.
03:56
How do you mark a supply zone from a strong downward move?
Find the first candle of the down move and use the rectangle tool from its bottom to its top.
05:24
What is the minimum reward-to-risk ratio required to take this trade?
A reward-to-risk of at least 2.5.
06:35
Use the Gann box for discount zones
It replaces subjective support-resistance drawing with a small, repeatable zone based on a specific ratio.
01:43Liquidity is simply the stop-loss pool
This is a clear mental model for why price tends to visit old highs and lows before continuing the trend.
03:56Mark supply/demand from the first candle
A simple way to define a high-probability reaction zone from a sharp move, without guessing.
05:24The 2.5 risk-reward filter
This rule alone would prevent traders from taking many low-quality potential losses.
06:35[00:00] I ve carefully curated a trading strategy, where I ve backtested thousands of trades. After hours of testing and Backtest after backtest. I think I finally curated the exact strategy I ll be using in 2025. And I m sharing it with you for free.
[00:19] I ll be using Tradingview. If you don t yet have it, I ll leave a link in my description. Next, for this strategy, I ll be using the 15 minute timeframe. So click that. Now this strategy includes 5 steps.
[00:32] And all 5 of these steps are crucial in the success of this strategy. Meaning, if you skip or mess up just one of these steps. The strategy will go up in flames and you will lose all of your money. So make sure you follow these steps to a tee.
[00:50] The market is filled with uptrends and downtrends. Our job as the successful trader we are, is to identify these trends and make sure we are trading with them and not against them. This will usually be pretty easy to spot.
[01:04] If a chart is making lower lows and lower highs, it s a downtrend. If its not obvious whether we are in an uptrend or downtrend. That probably means that you re
[01:16] looking at a consolidating market and you shouldn t touch it with a 6 foot pole. and lower lows for the past couple of days. Consistently breaking the previous low.
[01:31] With that information, we are going to assume it will continue on that path trade to capitalize on it. Now that we know we are in a
[01:43] downtrend. We are going to zoom in on our chart. If we analyze this most recent price movement. We can see price recently broke this low and is starting to correct a bit. To do this, go to the left hand side tool bar. Click this arrow and switch to the gann box tool.
[02:01] This should give you something that looks like this. Uncheck all of these values besides 0, 0.5, and 1.
[02:14] I ll also be changing the color of these values to white so it s not disgusting looking. Then uncheck all of these time levels. After all of this, you should get something If we go back to our example. Price broke all of these lows
[02:30] Price recent broke this low and is starting to correct Step 2 is identifying our discount zones. To do mark from the low that broke the recent low to the previous swing high. This will give us our discount zones.
[02:45] Price will naturally want to go to these zones. Since we are in a downtrend and looking for look for trades in this upper discount zone. Meaning, if there are any setups in the lower and move to the next step. Our third step is to identify
[03:00] important step as liquidity is what will give our trade fuel to move. I found a new broker. AAAfx.com. and this is no ordinary broker They offer forex,
[03:16] stocks and crypto. Yes, a 3 for 1. So no matter what silly little thing 0% commissions. Yes, you heard me right 0% commissions for all of your trades.
[03:30] So unlike most brokers, where you have to pay fees for every trade you take I mean really think about it, if you re taking hundreds of trades, those fees can really add up to where you re paying hundreds if not thousands of dollars.
[03:43] On here, its absolutely free. Plus, they are available in 176 use my link in the description. And you will get unlimited 0% commissions if you use my link.
[03:56] form is just a high or low. Traders will naturally set stop So if price ever comes back to this zone, it will naturally hit all of these traders stop losses.
[04:09] Grabbing all of this liquidity to fuel the trade to head lower. So to put it as simply as I can. Liquidity in its simplest a high, then another low. Meaning this high, can be a
[04:24] perfect point for a liquidity grab. As there will naturally be tons of stop losses from traders above this high. Not only that, but this liquidity is in our Remember, the market will always need some form of liquidity before the real move happens.
[04:40] Demand is the start of a strong move upwards. Supply is the start of a strong move downwards. An easy way to mark your supply and demand zones is by finding the first candle of said move,
[04:54] So here we have a strong move upwards. We find the first candle of this move. of this candle. This is our area of demand. So now we know a ton of traders bought very
[05:10] strongly at this price and we can expect if price ever comes back down to this demand zone again. Traders will have the same styled mindset and want to buy at this price again. Same goes for areas of supply. Find a strong downwards move.
[05:24] Price will naturally want to come back to this area of supply. Then fall afterwards. So if we go back to our example, price started a strong downwards move from this point. So we grab our rectangle tool.
[05:38] Mark the from the bottom to the top of the candle that started this downwards move. is that our area of supply is above our liquidity and is also in our discount zone.
[05:52] Then finally moving on to our 5th and final step is to enter the trade. So in order to enter our trade we have to make sure 3 things are true. Which price has done. Next, we want price to enter
[06:05] our area of supply. Which price has also down. Then finally, we want all of this to happen in We enter the trade as soon as price enters our supply zone. Set our stop loss above the area of supply. Set our trake profit at the low.
[06:20] And after setting up this trade it gave us a risk to reward of 7.47. Which is absolutely beautiful. beautiful risk to reward just like we did here. But a rule to follow is that if the risk to reward
[06:35] is under 2.5 risk to reward we do not take the trade. So only take trades with a risk to reward this higher than 2.5. Let s do an example for a long trade. First we do our first
[06:49] step and and identify the trend. Price is making higher lows and higher highs and is making breaks of structure to the upside. So we are in a uptrend and are only tool and mark from the most recent low to the most recent high to view our discount zone.
[07:06] Since we are taking a long trade. This time, our discount zone is in the bottom half of this gann box tool. So we only look for trades in this bottom half. Which is also in our discount zone. Which is a perfect point of liquidity.
[07:23] Next Mark our area of demand. The start of this uptrend This is our area of demand. Notice how also, this area of demand is in our discount zone. Wait for price to come to this area of demand. Set our stop loss below the area of demand.
[07:38] Let the trade play out and we get a beautiful winning trade. This is the exact strategy ill be using in 2025 and there s a reason for that. Because of how well it works in the market. Don t let emotions like fear
[07:52] steps and follow the exact trading plan. You will succeed in 2025.
⚡ Saved you 0h 08m reading this? Transcribe any YouTube video for free — no signup needed.



![BEST MACD Trading Strategy [86% Win Rate]](https://img.youtube.com/vi/rf_EQvubKlk/mqdefault.jpg)