
Stop Trading on Hope!
45sStrong opening statement that challenges common trading mistakes, making viewers curious about the logical alternative.
▶ Play Clip"The title promises a strategy that removes hope, but the video is mostly a live trade demonstration with repeated setups and a heavy pitch for the Telegram channel."
This video presents a trading strategy for binary options that uses two technical indicators—the Stochastic Oscillator and Williams %R—to identify high-probability entry points. The presenter demonstrates the strategy in real time, showing how to filter out false signals and execute trades with clear conditions rather than relying on hope.
Entering the market without clear conditions is 'hoping', not trading. The strategy aims to remove hope and rely on logic.
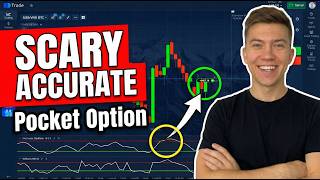
Use classic candles on a 10-second timeframe. Add Stochastic Oscillator and Williams %R. For Stochastic: K period 10, turn off D line, K line white width 2, 20 line green width 2, 80 line red width 2, opacity max. For Williams: period 10, main line white width 2, -20 line green width 2, -80 line red width 2, opacity max.
Stochastic white line crosses red line from top to bottom, signaling weakening bullish impulse. Williams confirms the same crossover. Sell trade opened for $66, expiration 1 minute, profit $60.
After a long upside move, candles show fatigue and close lower. Both indicators confirm a bearish move. Sell trade for $126, profit $116.
Price makes a sharp push higher but momentum fades quickly. No follow-through, new highs slow down. Sell trade for $243, profit locked in.
During a controlled downside move, selling speed drops and reversal signs appear. Buy trade for $467, profit $429. Final balance $896.
The strategy relies on confirming momentum shifts with two oscillators and entering trades only when both align. The session ended with a balance increase from $66 to $896, demonstrating the method's potential.
What is the recommended timeframe for this strategy?
10 seconds
00:40
What are the two indicators used in this strategy?
Stochastic Oscillator and Williams %R
00:40
What is the K period setting for the Stochastic Oscillator?
10
00:40
What does the white line crossing the red line from top to bottom indicate?
A bearish signal (weakening bullish impulse)
02:05
Why is confirmation from both indicators important?
It provides direct confirmation that the downside is gaining strength and becoming more stable.
02:43
What is the typical expiration time used in the examples?
1 minute
02:05
What signs indicate a reversal after a strong upside move?
Candles close lower, new highs slow down, and buying pressure weakens.
03:14
What was the final balance after the session?
$896
07:22
Trading with conditions vs. hope
Establishes the core principle that successful trading requires clear entry conditions, not emotional decisions.
Stochastic crossover as a signal
Demonstrates a specific, actionable technical signal for identifying momentum shifts.
02:05Confirmation with Williams %R
Shows the importance of using a second indicator to confirm signals and reduce false entries.
02:43Spotting exhaustion after a rally
Illustrates how to recognize when a strong move is losing momentum, a key skill for timing entries.
04:34Session result: $66 to $896
Provides a concrete outcome that demonstrates the potential profitability of the strategy.
07:22[00:00] Stop! If you're entering the market without clear conditions, you're not training, you're hoping.
[00:12] Today I'll show you a strategy that removes hope and leaves only logic. It clearly points to the moment when the move is already formed and the odds are finally on your side. We'll break it
[00:27] down in real time and see how it filters out false signals. My name is steven, I really appreciate a like and a subscription to the channel. Let's get started. First, let's get the tools ready.
[00:40] I'm using classic candles, time frame 10 seconds. Open the indicators tab and add stochastic oscillator and Williams. Let's set up the stochastic first. Set the k period to 10.
[00:53] Go to style. Turn off the D line. Set the K line to white with the 2. Set the 20 line to green with the 2 and opacity all the way to the right.
[01:05] Set the 80 line to red with the 2 and opacity all the way to the right. Then click save. Now let's set up Williams. Set the period to 10.
[01:18] Then go to styles. Set the main line to white with the 2. Set the minus 20 line to green with the 2 and opacity all the way to the right. Set the minus 80 line to red with the 2, push opacity all the way to the right and then
[01:36] click save. The indicators are ready to go if you trade from your phone to setup everything the same way. Want to see my market in real time and copy my trades automatically?
[01:49] Join my Telegram that where you get copy trading daily levels and private strategies Entry is free and spots are limited Message me if you want to From the first minutes it clear the upside is starting to lose strength
[02:05] Expiration 1 minute and I open a sell trade for $66. Let's go through this calmly, step by step, so we can see the entire logic without guessing.
[02:17] First, I watched the stochastic oscillator. When the white line crosses the red line from top to bottom, that tells me the bullish impulse is weakening and the market is starting to shift.
[02:31] This type of signal often shows up right at the beginning of a downside move when buyers lose control and selling pressure slowly builds. Next, I confirmed it with Williams.
[02:43] Here, we see the same thing. The white line also crosses the red line from top to bottom. That's no longer a single hint, it's direct confirmation that the downside is gaining
[02:55] strength and becoming more stable. The scenario plays out calmly, I lock in $60 and stay in the flow. Beautiful setup, expiration 1 minute and I open another sell trade for $126.
[03:14] After a long upside move, the market starts showing the first signs of fatigue, candles change their behavior, close lower and no longer support the previous pace.
[03:27] You can clearly see the upside impulse fading and seller pressure beginning to build. The reversal develops calmly and logically, no chaotic spikes, no emotional moves.
[03:39] The bull structure breaks down and price smoothly transitions into a downside phase. The market can no longer hold elevated levels and direction becomes easy to read At this moment both indicators fully confirm what happening on the chart They clearly point to a bearish move so the scenario looks justified
[04:04] and probability stays on our side. The move runs out and correction starts.
[04:19] I lock in $116. The plan is working. After a strong impulse, the chart looks overheated. Expiration 1 minute and I open a sell trade for $243.
[04:34] Price makes a sharp push higher, candles stretch, and the move looks aggressive and fast. At first glance, it feels like the rally is just getting started, but only a few bars
[04:47] later you can already see the impulse fading. There's no follow through, the market can hold a loss. New highs slow down, each next push higher becomes harder than the previous one, buying
[05:02] pressure gradually weakens and the energy that was driving the move starts running out. This is exactly the moment when the price is still rising but confidence is already
[05:14] gone. Then we see a clean pullback, candle starts closing lower, the structure shifts and price begins rotating into a downside move.
[05:26] In this picture, the scenario looks logical and I expect the correction to deliver. Mate, if you still have questions after watching this video, send me a private message on Telegram
[05:39] and I be happy to help you personally Clean execution I locked in and move into the final part of the session The final entry forms during a controlled downside move
[05:59] Timer 1 minute and I open a buy trade for $467. Price continues lower with confidence. We see a sequence of clean closes below previous levels.
[06:13] The move is structured and directional, sellers hold control for a sustained period and the downside impulse leads clearly, but closer to the end of the phase, you can see the selling
[06:27] speed slowly dropping, candles become less aggressive, new lows take more effort, and pressure from above starts to fade, the market is losing momentum.
[06:40] that background the first signs of reversal appear price stabilizes as well momentum flattens and the move starts to rotate upwards in this situation
[06:53] expecting an upside continuation is logical and the direction change becomes just before. The entry plays out. I'm looking $429 and the balance reaches $896. Let's wrap
[07:22] the session up. Very solid session. My balance went from $66 all the way to $896. That is a strong result. And if you have any questions about the method or you want to understand it deeper,
[07:36] don't hesitate. Message me on Telegram and I'll be happy to help you. Thanks a lot for watching, for subscribing and liking the video. See you next time. Trade smart.




⚡ Saved you 0h 07m reading this? Transcribe any YouTube video for free — no signup needed.