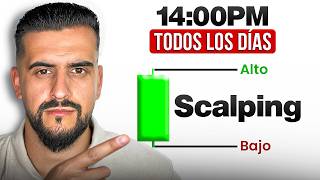

I Quit My Job to Trade Full-Time
45sThe promise of quitting a job and living off trading in just 2.5 hours a day is a highly aspirational and attention-grabbing hook.
▶ Play Clip"Title promises a proven strategy but delivers a basic overview with some examples; lacks depth and proof of '1000 times' testing."
Benjamin, a trader with over 7 years of experience, shares a scalping strategy focused on the New York Stock Exchange session. He emphasizes trading against the majority by looking for liquidity grabs and imbalances, and provides real chart examples to illustrate his approach.
Benjamin introduces himself, claiming over 7 years in trading, 5 years living from it, and over $80,000 withdrawn from funding accounts. He shows payout certificates from FTMO, Alfa Capital, Funden Next, Orion Fundo, and Neoma.
The New York Stock Exchange is open from 2 pm to 4:30 pm Spanish time, which is when 90% of the movement occurs due to high volatility and volume at the opening. He recommends trading during this window.
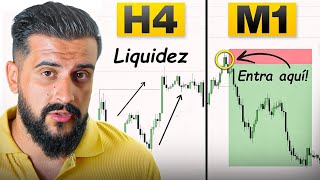
The strategy involves two scenarios: taking liquidity (buying at lows, selling at highs) and looking for imbalances (gaps between first and third candles). He emphasizes trading opposite to the majority.
He provides examples of liquidity grabs and imbalances on real charts, showing entries during the New York session. He notes that news events can trigger moves to liquidity zones, and he uses stop-loss orders of 4-6 pips.
He reiterates the importance of trading at the right time and looking for the two scenarios. He claims the strategy has allowed him to withdraw over $380,000 from funding accounts and invites questions in the comments.
The video presents a scalping strategy based on trading during the New York session, focusing on liquidity grabs and imbalances, and trading against the majority. Benjamin emphasizes the importance of timing and provides real examples to illustrate the approach.
What is the optimal trading window for the New York session according to the video?
From 2 pm to 4:30 pm Spanish time.
01:52
What are the two scenarios in the trading strategy?
Taking liquidity and looking for imbalances.
04:00
How does the strategy suggest trading when price breaks a high?
Look for selling opportunities.
05:18
What is an imbalance in the context of Japanese candlesticks?
A gap between the first and third candle where they do not touch.
07:06
What stop-loss range does the trader recommend?
Approximately 4 to 6 pips.
15:08
Optimal Trading Time
Identifies the specific time window where 90% of movement occurs, crucial for timing entries.
01:52Trading Against the Majority
Emphasizes contrarian approach, buying at lows and selling at highs, which is counterintuitive to most traders.
04:15Imbalance Definition
Provides a clear definition of imbalance as a gap between first and third candles, a key technical concept.
07:06News Events and Liquidity
Explains that high-impact news can trigger moves to liquidity zones, highlighting the role of news in trading.
10:28Claimed Success
States the strategy has allowed over $380,000 in withdrawals, providing motivation but also requiring skepticism.
16:21[00:01] In this video I'm going to show you how just 2 and a half hours is more than enough for you to become profitable in trading and make a living from it. If you don't know me, I'll introduce myself quickly. My name is Benjamin and I have been dedicating
[00:15] my time to trading for over 7 years. I have been living exclusively from trading for approximately 5 years and have withdrawn more than $80,000 from funding accounts. And I'm not making this up . I always like to show
[00:31] all the payout certificates here so you can see that it's absolutely true. For example, at FTMO I have a total withdrawal of over 47,000. At Alfa Capital a total of $92,000 and for example at Funden Next.
[00:54] with just three companies, but also, for example, in Orion Fundo I have three other withdrawals that you see here and in Neoma I also have a few withdrawals. I'm not doing this to show off or to make you think I'm the best trader
[01:09] in the world, not at all.
[01:22] brightest or the smartest person in the world. I am a person who became obsessed with trading a few years ago, who quit his job and dedicated himself full-time to trading. And here I'm going to show you some tricks that
[01:36] I currently use to achieve these results that I've already shown you. The first thing we need to be clear about is what time we are going to execute the strategy and what times we need to focus on the chart, because this is the
[01:52] most important thing. As you can see, I have noted here that the New York Stock Exchange is have noted here that the New York Stock Exchange is open from 2 pm to 4:30 pm, Spanish time. Obviously the London Stock Exchange covers a wider area
[02:06] , but the vast majority of volatility, the greatest manipulation and subsequent distribution movement, which is what interests us—
[02:18] that the price moves strongly towards the area we want—occurs during this time from 2 pm to 4:30 pm. It is where practically 90% of the movement takes place on the
[02:34] New York Stock Exchange. Because? Because basically, that's where the New York Stock Exchange opens, and the opening is where there's the greatest volatility and volume, so that's where we're interested in keeping an eye on the market and
[02:50] finding and executing our trading strategy. I personally trade at two different times. the London Stock Exchange and the New York Stock Exchange. But in this video I'm
[03:02] only going to explain the New York Stock Exchange because I think that most people have free time in the afternoon, from 2 pm to 4:30 pm. Or if you are from Latin America, it is practically when
[03:16] your morning begins, which is around 8:00 AM, and it is possible to operate it. However, if you'd like me to make a video exclusively for the London session and tell you the times and what to look for, let me know in the
[03:31] and what to look for, let me know in the comments so I can see if you're interested in making a video dedicated solely to the London session. But in this case, we're going to analyze the New York session. Once you are clear on the time we are
[03:44] going to look at the chart and at what time we are going to look for and execute our strategy, you also have to understand what we are going to look for, what strategy we are going to use, what we are going to focus on and what we are going to have to
[04:00] analyze in the chart to execute our entry within that opening of the New York Stock Exchange. We will consider two types of scenarios. The first one, and the one I personally like the most, is taking
[04:15] liquidity. What is liquidity? Basically, it's what the market needs to move from one place to another. Where is that liquidity located? because it is located at every maximum and every minimum of the past. Obviously, I personally
[04:33] highs and lows, those liquidity zones, to define the daily 4-hour and 1-hour timeframes. Because? Basically because it gives me greater certainty in finding
[04:45] those points. The shorter the time frame, the more obviously a 5-minute or 15-minute liquidity zone is not the same as a liquidity point in an H4 or H1 timeframe. There is a greater concentration of money at those
[05:01] H4 and H1 daily points, because that is where many stop-loss orders and ultimately a lot of money are located. In summary, what we're going to look for is that when the price breaks a high, we're going to look for selling opportunities at the top,
[05:18] contrary to what the vast majority of people who trade do. When a price breaks a high, people usually go looking to buy. For me, this is a big mistake because keep in mind that what the vast majority do is usually
[05:32] the opposite of what the market does, so I have adapted my market does, so I have adapted my strategy to the opposite of most, people who trade, who buy when the price breaks a
[05:45] high and sell when it breaks a low , because they believe that it is in a bearish structure, that it will continue to fall, that it is in a downtrend , in an uptrend. If it breaks a high, and the reality is that it won't,
[05:58] that the price will do the exact opposite of what the vast majority does , so what you should do is understand the chart in the should do is understand the chart in the opposite way to what
[06:11] the vast majority does. That's how you'll make money, because if you follow the same have the same result as the is, ultimately, to lose money. So, to make it clear, what are we going
[06:24] to look for in the first scenario? One, if the price breaks a high, look for sales. And two, if the price breaks a low, look for buying opportunities. That is ultimately the summary of the first scenario. So if the price on the
[06:38] New York Stock Exchange from 2 pm to 4:30 pm, Spanish time, reaches a high, I will look for sales. And if the price takes a low on the New York Stock Exchange from 2 pm to 4:30 pm, Spanish time, I will look for
[06:52] buys, it breaks the low, buys, it breaks the high, sells. That would be the summary of the first scenario we have in the strategy. The second scenario we will consider when executing our strategy within that timeframe
[07:06] is to look for imbalances. In short, look for a gap between the first candle and the third candle. As you can see in this image, we have three Japanese candles here. You can watch the first, second, and third ones. Well, when
[07:21] the first Japanese candlestick and the third one— this is the first, this is the third, this is the second—when the first and the third do not touch, that is where an imbalance would arise, as you can see here. And in turn, here's
[07:36] another example: when the price goes up, it has three candles. 1 2 3. First candle, second candle, third candle. As you can see here, these two candles do not same scenario in sales as in purchases. That would be an imbalance, that is
[07:52] , a gap between the first candle and the third Japanese candle. There too, when the price touches that imbalance, that gap between the first and third candles within our timeframe, there we would also look for entries to
[08:07] look for sales or purchases depending on whether the imbalance is upwards or downwards. Obviously, when the price goes down, this would be an imbalance in sales. When the price touches this level again, then we'll be looking for
[08:22] potential sales. And when the price rises and touches it again, what we're going to look for are potential buying opportunities. If the price clearly gives us entry confirmations and is also at that time I already mentioned, during the
[08:38] New York Stock Exchange hours. And now I'm going to explain some examples so you can see it with real Japanese candlesticks and on a real chart and understand everything. Let's start with the first example and the first scenario. We have
[08:52] example and the first scenario. We have here a maximum available, that is, it has not been liquidated, it has all the money up here, all the stop losses, take profits, pending entries, pending orders, everything available for
[09:05] the price to take it. Therefore, what we are going to wait for is for the price to liquidate it, to take all those entries, all those stop-losses, all those take-profits, absolutely everything, so that the price
[09:19] will reverse, first manipulate and then distribute to the opposite side. What time are we going to expect this? Well, on New York time. That's where we'll be watching to see if the
[09:34] price will settle and to take that position. In this case, in sales, as I mentioned before, when the price breaks a high, we are not looking for buys, we are looking for sells. Whenever the price goes either way,
[09:47] what we're going to do is look for the exact opposite. If it breaks a high, sell; if it breaks a low, buy. So all we're going to do buy. So all we're going to do is wait for the price to take it in the
[10:00] New York session. As you can see here, the price clears that area, but it does so outside of business hours, at 12 noon. I also remember this trade perfectly because I saw it live with my students, and
[10:14] I remember that this was a message from Trump talking about, well, a bit about the current war situation, and it was practically a message from Trump that went straight for all those positions. And this is no
[10:28] coincidence. In other words, when there is a message, a high-impact news item, and the price quickly reaches a high, a low, or an imbalance and then reacts by distributing to the opposite side, this is not a
[10:40] coincidence. The price is moving towards the liquidity zone, where there is market needs to be able to move in the should do in this example is wait for the price to
[10:55] example is wait for the price to return to the high to look for those selling opportunities, because firstly it was due to a random news item about Trump speaking out, and secondly the price has not cleared that zone, it is not
[11:09] above that zone within the New York time frame because it reached it at 12 noon. Therefore, when the price reaches that high again, when it's above that high again in the
[11:23] New York session, that's where we 'll look for our entry, okay? And as we see here, the price started that downward distribution, okay? I'll put it here for you. He's watching, the price keeps going down.
[11:38] could we have gotten in here? Well, I've already discussed this in other videos on the know my strategy well, I recommend two things. First, the fact that you free content about my strategy practically every day, is for a
[11:53] reason. And secondly, follow my YouTube channel, because I upload a lot of videos and examples of my trading strategy there. look, this is a very classic entry pattern that I trade, and basically,
[12:09] when the price generates an impulse and a gap, you could have entered here on the 5-minute timeframe and gone in search of the next liquidity point, which could very well be this low we have here, and I'd be giving you a 1-to-1
[12:23] return, look, a 1-to-1 risk- reward ratio at this low we have here. This would be the input pattern. breaks a record. That would be the first scenario. We are looking for sales within that New York stock exchange, within that
[12:38] time frame. Let's look at another example. As we can see, we are in the time frame of one hour. You have it up here in the euro-dollar currency pair. I personally operate on the only pair I do , practically because I've been
[12:50] operating on it for many years. It gives me very good results and I feel very comfortable with it. What do we have here? Well, we have a gap, what I mentioned earlier, an imbalance, okay? The one-hour timeframe and
[13:03] we see that the price enters into that imbalance right at the time I mentioned to you, at 2 pm New York time . You have it down here. As you may be noticing, the price hits that gap and plummets. Where to
[13:17] ? Well, in the direction I mentioned to you. When the price creates a bearish imbalance, what we are looking for are sales. Where is the price headed? Well, until the next liquidity zone towards the minimum. This would be another
[13:32] possible scenario. At what time? As I mentioned, within the New York session, from 2 pm to 4:30 pm. Let's look at another example. As you can see, there are a lot of them. What do we have here?
[13:47] A maximum of one hour in the time frame . And we see that the price will be taken at what time. Well, precisely within that New York Stock Exchange opening at 3 pm, Spanish time. By the way, if you have any doubt about what
[14:02] this time is in your country or where you are currently located, GPT and it will practically price eliminates this high within the
[14:15] New York session and what does it do? Well, it goes in the exact opposite direction. The vast majority of people here would look to buy because they believe the price will continue its upward trend, but what the
[14:28] price actually does is manipulate that high to eventually fall in the opposite direction, distributing in the opposite direction from what most people think the price will follow. They believe it will continue
[14:42] to buy, that it will continue to rise and they will become millionaires by buying, but ultimately the price manipulates that high, gathers all that money, all that liquidity that was available, and finally distributes it in
[14:55] the opposite direction. What's the next liquidity zone? This minimum that we have here. Therefore, you would look for sales from this area to this area, and using stop-loss orders like I use, of approximately 4 to 6 pips, you would collect
[15:08] a fairly large risk-reward in just a few hours. And here we would have another example in this case, this time with an example in purchases with a gap, with an imbalance, as I mentioned at the beginning of the video. In the
[15:23] purchases section, we see that this candle here is the first candle, second candle, and third candle. The first candle and the third, which would be this one and this one, do not touch, so there was an imbalance there. What can we observe?
[15:37] Basically, the price falls into that gap. What time? Well, we'll see. He gap. What time? Well, we'll see. He enters precisely at 2 pm. Nothing new. The price enters into that imbalance, into that void generated by the
[15:51] imbalance, into that void generated by the first and third candles within our New York stock exchange opening from 2 pm to 4:30 pm, Spanish time. The price enters at that exact time, in that imbalance, in that
[16:06] zone, and all that remains is to execute our entry pattern, in this case looking for purchases. This is the end of the video. I hope you have fully understood what time you should operate, what time you should not
[16:21] operate, because that is also very important. And what are we looking for in the first scenario and in the second scenario? Like I said, this trading strategy is what has allowed me to withdraw more than 380,000 in
[16:34] withdraw more than 380,000 in funding accounts and with which I currently live solely from trading. If you have any questions, doubts, or video recommendations, leave them in the comments. You can also follow me on
[16:46] my Instagram, which is @beldealgo. And without further ado, I hope I've helped you, which is the most important thing and what I want: to help other people acquire this skill and be able to live exclusively from it. And I'll see you in
[16:59] exclusively from it. And I'll see you in the next video.


⚡ Saved you 0h 17m reading this? Transcribe any YouTube video for free — no signup needed.