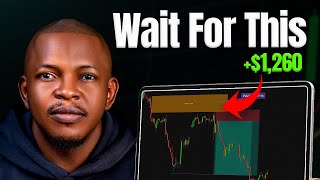

The Golden Zone That Catches Every Clean Move
44sOpens with winning trades and a mystery pattern, instantly hooking traders who want the secret.
▶ Play Clip"Delivers exactly what the title promises: a clear, actionable Fibonacci zone that the trader uses before every entry."
This trading tutorial introduces the 'Golden Zone,' a Fibonacci retracement zone between 0.62 and 0.79 that the creator uses to time entries before clean market moves. The video explains the theory behind Fibonacci, shows how to configure and draw the zone on TradingView, and walks through real trade examples on Bitcoin, gold, and EUR/USD, emphasizing the importance of confirmation and risk-reward ratios.
The video opens with three profitable trades, all hitting take profit, on different assets including gold and EUR/USD. The creator notes he would have missed all three without the Golden Zone.
The Golden Zone is a Fibonacci level between 0.62 and 0.79. In ICT terminology, this same area is called OTE (Optimal Trade Entry).
Fibonacci was a 13th-century Italian mathematician known for a number sequence found in nature, such as flower petals, seashells, and galaxy spirals. The sequence yields ratios like 0.62 and 0.79, which traders use to measure pullback depth.
Delta Exchange sponsors the video. It offers futures, perpetuals, and options on BTC, ETH, altcoins, and US stocks with up to 200x leverage, and charges a 0.01% taker fee compared to the typical 0.05%.
On TradingView, select the Fibonacci retracement tool. The creator shows his modified settings with 0.62 and 0.79 highlighted as the Golden Zone. For long trades, draw from bottom to top (left to right); for short trades, draw from top to bottom.
On the 1-hour chart, a break of structure (BOS) signals continuation downward. The Fibonacci tool is drawn from the top to the bottom, marking the Golden Zone as the target. The creator waits for price to tap this zone before looking for confirmation on the 5-minute chart.
Once price taps the Golden Zone, drop to the 5-minute timeframe and wait for an internal break of structure or change of character. Enter from there, with stop loss at the high and take profit at the low.
The setup must give at least a 3:1 risk-reward ratio. The Bitcoin trade in the example offered 4.7:1.
A gold trade used the same Fibonacci zone along with a 4-hour supply zone, but the Golden Zone alone was sufficient. After tapping the zone, a 5-minute change of character triggered a short that produced a 3.5 risk-reward ratio.
The final example is a long trade on EUR/USD. Price had a break of structure, retraced into the Fibonacci Golden Zone, and then continued upward. The trade hit take profit while the video was being made.
The Golden Zone is a simple, repeatable confluence area that the creator uses before every trade. Combined with higher-timeframe direction and lower-timeframe confirmation, it can produce clean entries with strong risk-reward ratios.
What is the Golden Zone?
The Fibonacci retracement zone between 0.62 and 0.79.
00:47
What does OTE stand for in ICT trading?
Optimal Trade Entry, which is the same area as the Golden Zone.
01:01
Who was Fibonacci and what was he famous for?
A 13th-century Italian mathematician famous for a number sequence found in nature.
01:14
When going long, how do you draw the Fibonacci retracement tool?
From the bottom to the top, left to right.
04:33
When going short, how do you draw the Fibonacci retracement tool?
From the top to the bottom.
05:15
What minimum risk-reward ratio does the Golden Zone setup require?
At least 3:1.
07:34
What does BOS stand for?
Break of structure.
05:58
What timeframe does the creator use for confirmation after price taps the Golden Zone?
The 5-minute timeframe.
07:05
What is the taker fee on Delta Exchange compared to most crypto exchanges?
Delta charges 0.01%, which is five times lower than the typical 0.05%.
02:52
Golden Zone Definition
Clearly defines the core concept that drives the entire strategy: a Fibonacci zone between 0.62 and 0.79.
00:47Why Fibonacci Works
Explains the natural origin of Fibonacci ratios and why traders rely on them, despite no one fully knowing why price respects them.
01:14Combining BOS with the Zone
Shows that the Golden Zone is only effective when aligned with the higher-timeframe direction, identified through a break of structure.
05:58Lower-Timeframe Confirmation
Emphasizes that waiting for a 5-minute break of structure or change of character prevents entering blindly at the zone.
07:05Risk-Reward Discipline
Makes a 3:1 minimum risk-reward ratio a non-negotiable rule for taking Golden Zone trades.
07:34[00:03] straight to take profit. This is another one. This one is gold. Same thing, straight to take profit. And this one is on EUR/USD. I'm still in this trade while making this video. One thing is common with all these trades.
[00:18] I would have missed all three if not for that one thing. That one thing is what I that one thing. That one thing is what I want to show you in this video. This is the golden zone. The zone where price comes back to before almost every clean
[00:33] comes back to before almost every clean move. The zone where I take almost every knowing this zone is one part of the equation. You have to know >> how to take trades from the zone. These two things
[00:47] >> [music] >> The golden zone is a Fibonacci level >> The golden zone is a Fibonacci level between 0.62 and 0.79. And don't worry, I will show you this on the chart real soon. If you trade ICT, you might know
[01:01] soon. If you trade ICT, you might know this same area as OTE, optimal trade entry. So, it's the same zone, just different name. But before we go into the charts, let me just throw more light on what Fibonacci even is.
[01:14] Fibonacci was an Italian mathematician from the 13th century. He is famous for a number of sequences that showed up everywhere in nature. So, you see it in flower petals, in seashells, in the spiral of the galaxy. From that
[01:30] spiral of the galaxy. From that sequence, you get specific ratios, 0.62, sequence, you get specific ratios, 0.62, 0.79, and a few others. Traders later noticed that price on the charts often pull back to the exact same ratio before
[01:45] continuing. And nobody fully knows why, but it happens often enough that it became a standard tool in technical analysis. So, Fibonacci is just that, a
[01:57] tool to measure how deep price has pulled back in a move. And 0.62 and the 0.79 range is the deepest part of a healthy pullback. That is the golden Now, let me show you exactly how to draw this on the chart and how I use it to um
[02:12] take the three trades I showed you earlier in this video. Now, before I continue, this video has a sponsor, Delta Exchange. So, give me 1 minute to talk about the offer. On Delta Exchange, you can trade [music] futures,
[02:25] you can trade [music] futures, perpetuals, and options on BTC, ETH, and altcoins with up to 200x leverage. What makes Delta Exchange different is >> [music]
[02:38] >> [music] >> and on US stocks like Tesla, Nvidia, Amazon, Google, and Meta. [music] So, you can trade those alongside your crypto on the same platform. But, the real reason to look at Delta is
[02:52] the fee. Most crypto exchanges charge around 0.05% in taker fee. Delta charges 0.01%. That is five times lower. On a $10,000 trade, you are paying $1 in
[03:08] On a $10,000 trade, you are paying $1 in fees instead of $5. Now, stretch that over hundreds of trades a year and you're keeping thousands of dollars in your account. On the option side, you are paying 0.01%
[03:21] on notional, capped at 7% of the premium. Spreads on BTC and ETH options are under two bps. And you can trade deep out of the money [music] and in the money strike with daily and weekly expiries.
[03:37] They also have a strategy builder. So, if you are running multi-leg options play, you can do it them directly on the platform. The link is in the All right, so let's start with how you draw this Fibonacci. So, if you go to
[03:51] your TradingView, this here it says Fibonacci retracement. So, this is a tool. So, when you click on it, you can draw it this way. Now, this is the modified
[04:03] um Fibonacci that I have. So, you can actually modify it to mine or you use the TradingView default. If you want to modify it to mine, I will show you the settings. So, if I click on settings,
[04:17] so, this is the settings. You can see I have 0 uh 0.62 in Fibonacci. You see 0.618, but I made my own 0.62. So, this is the setting I'm using, including the all that. You can use this or use the TradingView default. It's almost the
[04:33] same thing. So, if you look at this now, if you are trying to go long, if you want price to price to go up, right? You take the Fibonacci, draw from the bottom to the top, okay? Left to right.
[04:47] Then, you can see here, this is a 62. The 62, I marked it as >> [music] >> And 79 color yellow as well. So, this is
[04:59] from here is golden zone. I used to call this optimal trade entry. But for me, I just call it my golden Now, so that is the Fibonacci 11. Now, if you're going
[05:15] short, if you're going short, you take it from the top to the bottom. Okay? You can see it's now on top. Okay? You can see it's now on top. Also, um 6279 is the golden zone.
[05:27] click on settings. You can pause this video to set yours like this. If you've been following my video, you will know that teach you a lot of these >> [music] >> All right? Consistency is the key. So,
[05:43] if you look at this, this is Bitcoin. And when I was doing a live class, I it. So, don't forget to attend my lives on >> Mondays. Now, the next step is this. This is the top. We did a break of
[05:58] structure over here. BOS. price is meant to continue downwards. [music] retrace to before coming down.
[06:11] We simply take the Fibonacci tool from this top because we're going in >> [music] >> to the bottom here. To this bottom then I extend. You see that. So, that is where I now
[06:25] mark this my golden zone. Okay. Before I got this golden zone, then I cannot remove the Fibonacci tool. Yeah, all I expect is that price comes here and go low. Okay, and this zone is
[06:38] simply my target. So, I don't like to take this trade because you don't just >> There are things that happens. Currently, I'm in the 15-minutes time 1-hour time frame. So, I'm going back to the 1-hour. Now, all I'm interested is
[06:51] this. When price gets here, I look for confirmation entry in the 5-minutes time frame. So, that's all it is for price to get to the golden zone. So, let's play this and see that happen. Now, once price tap into this zone, we
[07:05] then go to the 5-minutes time frame. Okay, so in the 5-minutes time frame, all I have to do is simply the same thing. Wait for a break of structure. >> [music] >> Then, this is now an internal change of
[07:20] Then, I cannot take this trade. Take this trade from here. Our short position from here. Okay. Stop loss is at the high. Take profit is at this low. What is most
[07:34] important is that this gives you at least a risk reward ratio of three. Okay. This one is even giving us one. Now, let's see how this goes. >> [music] >> You see this tapped in.
[07:51] This is a Bitcoin trade. Now, the second trade I took was on gold. I'm going to you can see again we have a break of structure here. This one trade I also took here. I had a break of structure here. Then if
[08:03] I had a break of structure here. Then if you take these two from this top, if you mark these two from the top you drag it all the way down to the bottom and You will notice again that this is a golden zone.
[08:16] The yellow zone I marked out is a golden zone. Now, what again I also draw out the here the sub here 4-hour supply zone. supply zone. But you see that you will
[08:29] get into the supply zone. Only the golden zone was sufficient enough for this trade to go. So, let's play it. >> Again, once we have a tap in, you simply just go to the 5-minute time frame or
[08:45] even 15-minute time frame to take a trade. So, again you can see here that we now have a break of structure over here. Again, this is internal break of
[08:57] structure. And over here is a change of character. Right? Now, one way to take this trade is this. From the change of character, you can take a short position immediately from
[09:10] Okay? To this high and target this low. This gives a 3.5 now, which is an excellent trade. But what thing I did I still use the Fibonacci tool again. So, watch this.
[09:24] From this top to the bottom. the golden zone. And I can simply just do this.
[09:36] Put my my tool here. My stop loss above above and my take profits at the bottom here.
[09:50] risk reward ratio, 4.7. Now, let's see how this plays out. So, you can see I'm using the Fibonacci tool two times, the golden zone twice in tool two times, the golden zone twice in this case.
[10:07] the golden zone. Okay? smashed. So, this is straightforward. Now, this is a trade I'm currently in
[10:22] that happens. I'm entering this trade, but not this one. This one is So, this is the one. So, we have actually hit take profit right now while making this video. Uh you can see it was the same thing. Simple. We had a break
[10:38] Okay? Take this to the higher time frame. My intention was to trade this all the way this break of structure here, but I decided to trade it even from here to
[10:52] So, this is an example of a long position trade and we use the same Fibonacci here. So, from here, you will see that we did change of character here.
[11:06] the bottom here and you take it to the high here and drag it across, you will see the Fibonacci zone just light and what happened is that price just came down this way, tap into that zone, uh from
[11:21] there we went all the way up. If you want to see these trades exactly before I take them, use the link in the description to join my Telegram community. You can also copy my trades automatically by connecting your trading
[11:34] account to copy me. Copy me is a copy trading platform where real traders, including me, take this exact Coding Zone setup and your account follows along, sized to your own risk. The waitlist is open
[11:48] right now in the description. We are launching really soon. launching really soon. See you there.



⚡ Saved you 0h 11m reading this? Transcribe any YouTube video for free — no signup needed.