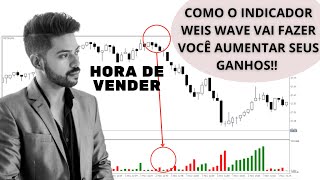

The Secret to Reading Volume Like a Pro
45sDirectly addresses a common trader pain point—understanding volume—with a promise of a simple, actionable tip.
▶ Play Clip"Delivers a solid tutorial on the indicator, though the title's 'surreal' claim is overblown."
This video explains how to use the Waze Wave Volume indicator to analyze market trends and identify trading opportunities. The presenter demonstrates how to combine volume and price action to spot trend reversals and pivot points, using the indicator on TradingView.
The presenter emphasizes that volume and price are the foundation of their trading analysis, with indicators used to combine them.
Waze volume is widely available on binary options, B3, and cryptocurrency platforms, but many traders don't know how to analyze it effectively.
The indicator shows pronounced volume during active market movements and weak volume during low liquidity periods, typically outside business hours.
Volume analysis is used for trend movements, retracements, and continuation patterns like pivots (ascending or descending).
A bullish pivot requires high buying volume on upward moves, low selling volume on downward moves, and increasing buying volume on the next rise.
To catch a trend reversal, monitor for strong volume in one direction, then a loss of interest (low volume) from that side, followed by a trigger in the opposite direction.
When sellers lose interest (low volume on downward moves) and price fails to break support, it signals a potential reversal to the upside.
The presenter shows a downtrend with high volume, then low volume on a retracement, and a double bottom at support with no selling interest, leading to a buy trigger.
Entry on the trigger candle with stop below the double bottom, exit when a red candle appears or trend weakens.
A descending top pivot forms when selling volume is strong, buying volume weakens, and price makes lower highs, confirming a sell setup.
The Waze Wave Volume indicator, when combined with price action, helps identify trend reversals and pivot points for profitable trades across multiple markets.
What are the two core elements the presenter uses for trading analysis?
Volume and price.
00:12
What does a bullish pivot require in terms of volume?
High buying volume on upward moves, low selling volume on downward moves, and increasing buying volume on the next rise.
03:15
How can you identify a potential trend reversal using volume?
Look for strong volume in one direction, then a loss of interest (low volume) from that side, followed by a trigger in the opposite direction.
04:10
What does low volume at a support level indicate?
Disinterest from sellers, suggesting a potential reversal to the upside.
06:14
Where should you place a stop loss when entering a reversal trade?
Below the recent swing low (for a buy) or above the recent swing high (for a sell).
08:10
Volume and Price as Foundation
Establishes the core principle that volume and price are the primary tools, with indicators as supplements.
00:12Bullish Pivot Volume Requirements
Provides a clear, actionable volume pattern for identifying bullish pivots.
03:15Trend Reversal via Volume Disinterest
Offers a systematic method to catch trend reversals by monitoring volume exhaustion.
04:10Disinterest as a Signal
Highlights the importance of low volume as a sign of weakening trend momentum.
06:14Double Bottom with Low Volume
Demonstrates a real trade example combining support, double bottom, and volume disinterest.
08:10[00:12] you a tip on how to analyze the Waze Wave volume. There are two things I particularly like to analyze when I'm trading: volume and price. Of course, I use some indicators to combine
[00:25] some indicators to combine everything, but the basis is price and volume. There are several volume indicators that we can analyze, such as which is this one you know, the Kendall Kendall, right?
[00:38] There's volume in price, which is the volume profile, White Price, there's the today we're going to talk specifically about Waze volume because it's good because it's used by several brokers, firstly, several
[00:53] binary options brokers in the Brazilian market, the B3 cryptocurrency market, so most platforms have the Waze, but most people don't know how to analyze it, and it's very interesting. I'm going to use the Trade
[01:06] View just to give you this dynamic. So let's cut the digital fund part of about that, and let's get more into the practical part, okay? Okay, so we're going to understand this indicator. First thing, let's put it on the chart, right?
[01:18] So, here are the indicators, put the Wave indicator (there are several in the library). But let's focus on this main one. Here's the volume, which is the first modern
[01:30] you can see that right away I can already see that at some moments the volume is more pronounced, like in this movement, and then at other moments it's much weaker. This moment on the chart where the
[01:45] volume is very still, very bad, is because the market doesn't have enough liquidity, the market lacks volume, it doesn't have active trading at that moment, and interesting trend, right? It will remain a bit more yielding until it reaches a
[02:00] point where there's a specific play that aggressively moves the market, brings in more volume, or several people start trading. Generally, these times are between 9 am and business hours, right? Because when
[02:14] other international markets open, some other markets also open, and then the flow enters, the market creates a little more volume. But let's go, so in some situations there are more pronounced movements and in others the volume is very
[02:27] low. There are several ways you can also analyze the... Waze and volume are the use for trend movements, retracement movements, and trend continuation—the famous pivot, whether it's an upward pivot or a
[02:44] about an upward pivot, we have ascending bottoms, right? Building this movement. Many people trade on the breakout of the top or even catch the expansion movement again, the second wave of the trend. And then the
[03:00] descending movements, the downward wave making that downward pivot movement. Bringing this in with volume makes it a little simpler to analyze. For example, I want an upward movement with high
[03:15] buying volume, a downward movement with low selling volume. When the market starts to rise again, creating the famous pivot with ascending bottoms, and the buying volume starts to rise again, then we already have
[03:30] rise again, then we already have an upward pivot set up. So the possibility of you profiting in this period, if you believe in this upward pivot, bet, put your money, invest in this pivot, is a little more
[03:42] interesting because we have the market showing a price movement. The pivot structure and volume are confirming all of this, so basically what I need is a high volume with a strong upward trend, a low volume with
[03:56] low selling volume, and the market starting to rise again with a stronger buying volume. Then we have the bullish pivot configured. This same idea also works for the bearish pivot, but in reverse. But
[04:10] today I want to teach you a way to analyze when the market is going to change trend because many people don't understand, right? "Will the the market change trend? To catch the beginning of a new
[04:22] trend, you'll be drinking clean water there. So it's very interesting. Let's go. What I need is, first I need to monitor a moment on the chart where the volume is strong, where the volume is high. For example, let's
[04:38] movement is very interesting. Let's start analyzing here. We had a slightly more interesting volume, right? Where the market fell here, it brought this slightly more pronounced movement. You can see
[04:51] that the buying here isn't coming in strongly, right? That's this movement here, which is precisely what... We were talking about the pivot movement, right? So the market brought this downward movement as a
[05:03] downtrend with high volume, then this upward movement with low volume, and the market started to fall again, increasing once more. Although it didn't could already believe, for example, a small pivot, but that's not the idea. It's to catch the
[05:18] trend reversal. So, the selling hit here. You can see that it continues to increase its volume.
[05:30] price of the Euro/dollar, is still very present, so I can't act on the buying side at all now. What I need is to What I need is to identify that the sellers
[05:43] no longer have as much interest, that they start to leave the chart, lose can see the chart a little more freely to act on the opposite side and catch this upward movement again. So, you see, the selling is still very
[05:57] pronounced here, and then this movement came right after. Let's see here, this movement here already shows me the lack of interest on the selling side. I understand, so you see that here, the
[06:14] volume is already starting to... Where are the sellers who were here? They left the chart. So I can't measure, for example, the downward pivot movement anymore, right? So we're at the bottom. Look how interesting this
[06:28] disinterest is. The market came down again to a support region with low volume, and it couldn't break through that region. When the buying opportunity comes in again here, look, this candle with volume here again, right? Starting the
[06:43] we should enter. I'll even do a market replay so it's easier for us to understand. Let's go, let's start from here with this downward movement, start from here with this downward movement,
[07:00] The market started to move, and the volume started to increase. We're following it for now; we're doing absolutely anything in the market, we're just following for now.
[07:19] Let me erase this drawing we made there now. over. You see, it started to come in there, look, the green ones here, right? The green charts here on our Waze, volume, okay, but it is indeed a very interesting
[07:35] selling movement. If I want to act on the opposite side, what do I do? I need to make people wait for a lack of interest in selling anyway. Let's see where this trend stopped; it's basically in this region here, okay?
[07:57] very weakly, right? They weren't interested either. So let's see what will either. So let's see what will happen in the next downward leg.
[08:10] we needed. So you see that here we have a downward leg, a downtrend with a lot of volume, a lot of interest from the selling side. The market stopped. Here it started to rise with a slightly lower volume, right? And then it showed us
[08:23] again that the selling comes here. When it reached this support, it couldn't break through the support; it already stopped there, and the lack of interest in selling was also and the lack of interest in selling was also clear here for me. So you see, I no
[08:37] longer have interest in selling; the market stopped at the double bottom in this region. And then a buying trigger came in again. Look at the green ex-wave here, you see, once again showing this upward movement here. Man, I would already start thinking
[08:51] if I were in Forex? I would buy on this candle that triggered the stop below the bottom, right? Logically, there below the bottom that originated this double bottom. Support. So, I would try to play until the market
[09:08] gives me that complete movement. As long as it's going up, I'll make money there. Or you can use several targets as well, and today's video isn't about targets, it's about understanding the dynamics of this indicator.
[09:21] In binary options, you'll take the buy signals, now set a time frame of 5 minutes, 10 minutes, and place a buy order, or even one minute, take the one- minute triggers outwards. This also works for cryptocurrencies, for stocks, for everything.
[09:33] This type of analysis will work. But let's go, so I would have believed in the buy. Let's replay here, let's see what happened in the market.
[09:48] holding this movement. Can it continue? Do you have to wait for someone to continue? Do you have to wait for someone to finish? Of course, let's go. I'm exit here. Oh, in this candle, I had already exited, right? So it finished.
[10:03] This previous candle here had already exited from here. So look, see how we bought here and exited there in that candle when the little red candle came. So it's time for you to exit. You took advantage of the upward movement against the trend, which
[10:17] managed to catch the movement. Very interesting. You guys understood the dynamics, right? You understood? Let's go to another day, let's pick a previous day so we can do the same analysis, okay? Bye. So,
[10:30] this day started here, and then we started monitoring. So, this day had a very pronounced upward movement in this trend leg here. Then there was this movement, followed by a sell order with slightly less interest,
[10:44] possibly showing a correction movement. But then the buy order also came in without much interest. The volume didn't increase in the buy order, so it didn't set our bullish pivot. Okay, but let's continue then. Look, for the
[10:58] volume, this little volume came in here, quite interesting if we notice. The starting to lose interest. But let's go, look, this sell order came in with more interest,
[11:10] more or less in this leg here. Interest in selling increased. Look at this. Look at this, that's more or less what this movement was up to here. So pay attention here, we're going to put a support because this trend ended here. This
[11:25] trend is strong. Then came this buy order, then came this sell order. But pay attention, was this sell order that came in larger or smaller than the previous leg, than that previous movement? That previous trend was
[11:39] practically the same, man. Let's lie, I wouldn't have entered, no, even though it was Because it still shows interest in buying, in selling, sorry, but here it already shows disinterest. Look, pay attention, there came this sale again that
[11:55] ended here, so we came and marked the bottom, right, the end. fall again. Look what it did, it didn't pass the support, and with disinterest, the
[12:14] same situation as the next day, the same situation, entered a buy here, this trigger, what do we do, we activate the buy here, stop here, and now activate the buy here, stop here, and now believe in the upward movements,
[12:28] in the change of trend. Do you understand? So if you can understand the dynamics of this indicator, you work on two sides in favor of the trend, believing in the upward or downward pivots, or even
[12:43] identifying when the market will possibly change that trend so you can catch a new trend and take advantage of the "Clean Water" of that new beginning of the trend, there's nothing better than a strong downturn, it's a trend at the beginning
[12:56] of the trend. Okay, let's see here, look at this strong downward movement, right? The movement is very strong here, but the buying movements are also coming in well. Strong, high, only growing, let's buy, it's only growing, but the
[13:10] selling volume came in very strong here, very pronounced. Oh, look at this volume here, it appeared with buyer disinterest. So this movement was
[13:22] disinterest, we have the famous descending top. Look at this, so here it configures our pivot, yes or no, otherwise, folks, yes, correct, enter the sell again, descending top configured, put your
[13:38] finger on the trigger, okay? And here we have several ways to analyze, for example, a target, right? You can take, for example, this last leg of the trend here and project it as a target from this movement, it
[13:53] would have given more or less the target, or work when this downward movement ends move entirely, when this little green channel of the ex-Wave appears, you can get out, you can work with escape, man, you have
[14:09] several ways, right? I'm not going to talk about targets here now because it's not the objective of the video, but there are several ways, binary options, five minutes down, 10 minutes down, take one minute each candle, selling retracement, everything
[14:22] related to selling in this scenario, okay? So I hope you understood a little bit of this Wave dynamic, which is a very cool indicator, tell me. So, if you're going to add this indicator to your chart, to your setup, you'll have to study it a
[14:35] bit more, right? It's going to conflict with some things because if you trust some things, it's going to be very strong, it has a huge potential. Okay, if you liked it, leave your like, okay? Follow me on social media,
[14:48] where I'll be showing you how to analyze this indicator a bit more strongly, day by day, showing it day by day. Also follow me on Telegram, I post daily content there for you and we can chat. Okay? A
[15:03] big hug if you liked it. Leave a like.



⚡ Saved you 0h 15m reading this? Transcribe any YouTube video for free — no signup needed.