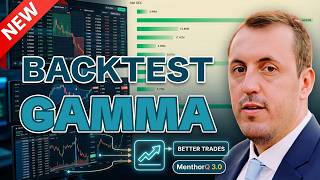

First Real-Time Gamma on Futures
60sReveals a unique feature that is both educational and impressive, appealing to traders interested in cutting-edge tools.
▶ Play Clip"Delivers on the promise of a new workflow with concrete features, though some parts feel like a product demo."
MenthorQ 3.0 is a major platform overhaul designed to help retail options traders move from data to decision faster. The update introduces real-time gamma levels on futures, an integrated TradingView charting experience, gamma level backtesting, and an enhanced AI assistant named Queen. Founder Fabio Ruggeri explains how these features unify research and trading in a single workspace, bridging the gap between institutional and retail trading tools.
MenthorQ 3.0 is a complete redesign of the application, integrating real-time data, gamma levels, and charting into one workspace to help traders move from data to decision faster.
MenthorQ aims to fill the gap between institutional and retail trading by providing high-quality real-time data and insights in one ecosystem, avoiding fragmented research tools.
The platform is built for active traders of options, futures, and equities, including those trading SPX, 0DTEs, ES, and Q, who want to understand market data to make better decisions.
After three years of adding features, the platform became powerful but complex. 3.0 simplifies the workflow, reducing the distance between research and trade decisions.
MenthorQ is the first platform to offer real-time gamma levels on futures, using options data from CME, COMEX, NYMEX, and CBOT, covering indices, commodities, and more.
The platform integrates TradingView's charting library, giving users the same charting experience with 150+ indicators, plus proprietary gamma and volatility indicators, all updating in real time.
A new backtesting tool analyzes historical gamma levels (one-day max, core resistance, etc.) to show the probability of a level holding, helping traders structure spreads and manage risk.
Queen is an AI engine integrated with MenthorQ's data, providing insights, trading roadmaps, and real-time news, not just a chatbot.
Traders can start the day by checking overnight changes in SPX, QQQ, ES, and NQ, monitor price movement toward gamma levels on charts, use backtesting to plan trades, and leverage AI for ideas—all in one place.
Gamma levels on futures are updated every 5 minutes, with Q-score, volatility risk premium, skew, and term structure available for futures, helping traders set stop-losses and take-profits.
The TradingView integration allows overlaying proprietary indicators like skew and implied volatility on charts, with no additional subscription needed and no limit on indicators.
Backtesting shows that in similar market conditions, the one-day max level held 91% of the time, with median and average moves when broken, providing clear risk parameters.
Queen can analyze historical data, provide trading roadmaps, and screen for opportunities, covering futures and equities, making it a comprehensive AI trading assistant.
Fabio starts his day monitoring overnight futures flow, uses backtesting to plan credit spreads, and uses Queen to screen for swing trade ideas, all within MenthorQ.
The major upgrades are real-time gamma on futures, gamma backtesting, and enhanced AI capabilities, all aimed at improving trading efficiency.
MenthorQ 3.0 represents a significant leap in retail options trading tools, unifying real-time data, advanced charting, backtesting, and AI into a single platform. This integration empowers traders to make faster, more informed decisions, bridging the gap between institutional and retail capabilities.
What is the primary goal of MenthorQ 3.0?
To help traders move from data to decision much faster by integrating real-time data, gamma levels, and charting into one workspace.
00:43
What problem does MenthorQ solve for retail traders?
It fills the gap between institutional and retail trading by providing high-quality real-time data and insights in one ecosystem, avoiding fragmented research tools.
01:25
Who is MenthorQ's target audience?
Active traders of options, futures, and equities, including those trading SPX, 0DTEs, ES, and Q, who want to understand market data for better decisions.
02:35
What is the first platform to offer real-time gamma levels on futures?
MenthorQ is the first platform to offer real-time gamma levels on futures, using options data from CME, COMEX, NYMEX, and CBOT.
04:39
How often do gamma levels update in MenthorQ 3.0?
Gamma levels update in real-time every 5 minutes.
04:56
What is the benefit of integrating TradingView charting?
Users get the same charting experience with 150+ indicators, plus proprietary gamma and volatility indicators, all updating in real time, with no additional subscription needed.
05:54
What does gamma level backtesting show?
It shows the probability of a gamma level holding for the day, based on historical data in similar market conditions, helping traders structure spreads and manage risk.
06:48
What is Queen in MenthorQ 3.0?
Queen is an AI engine integrated with MenthorQ's data, providing insights, trading roadmaps, and real-time news, not just a chatbot.
22:28
What is the success rate of the one-day max level holding in the backtest example?
In the example, the one-day max level held 91% of the time in similar market conditions.
18:16
Complete Redesign
The core promise of the update: integrating all tools into one workspace to speed up decision-making.
00:43First Real-Time Gamma on Futures
A unique feature that no other provider offers, giving traders a significant edge.
04:39Gamma Backtesting
A novel tool that quantifies the probability of levels holding, enabling data-driven risk management.
06:48Backtest Success Rate
Concrete numbers (91% hold rate) demonstrate the practical value of the backtesting feature.
18:16Queen AI Integration
Shows how AI can be deeply integrated with trading data to provide actionable insights, not just chat.
22:28[00:02] move from data to decision much faster. So, we've integrated everything in one space. This is a a new feature that no other provider that we are aware of provides. >> Mentor Q helps retail options traders
[00:15] see the market the way institutions do. Today, founder Fabio Ruggeri is here to Today, founder Fabio Ruggeri is here to launch Mentor 3.0, a complete overall of the platform. Hello, Fabio. >> Hi there. Nice to meet you and nice to
[00:29] me. >> Fabio, you've called this the biggest leap Mentor Q has ever made. So, I'll give you 30 seconds. What's the one thing traders can do today that they couldn't do yesterday?
[00:43] >> We have basically launching a complete new redesign of our application, and the the real goal is really to help traders move from data to decision much faster. So, now you can enjoy real-time data, real-time gamma levels. We have built
[00:58] our own charting applications. We have integrated that, and basically you can overlay all this information in one single workspace, so that you can now bring your decision and research faster and obviously be more action in the
[01:11] market. So, I think for us this was a very important need, and we are so happy to launch it today. >> Before we go into all the news, just tell us what is Mentor Q, and what problems are you trying to solve for
[01:25] options traders? >> Uh yeah, so my background is in the institutional space. So, I worked at Bloomberg for about 11 years, and for a very long time uh institutions had access to data, research, and
[01:38] information, and traders were kind of left behind with fragmented research. So, when we started uh Mentor Q, really the goal was to build an analytical and uh um data platform that traders could use, so active traders, retail traders
[01:53] could use to connect the dots and fill the gap between what's available in the institutional world and what's available in the retail space. So, most retail indicators, they look at a lot of charts, and they look at news, but
[02:05] sometimes all these tools are completely disconnected, so it's hard to make sense of this information. So, what we've done is really we've tried to bring in high-quality data real time so that we can actually create a real powerful
[02:21] insight that traders can leverage inside one ecosystem instead of having to go into different tools and obviously lose the momentum and lose the price action. >> Traders, of course, come in all fashions and knowledge level. Who is this
[02:35] platform particularly built for? >> Our target trader is really somebody a beginner trader, you can be an advanced trader, but it's an active
[02:47] options, futures data, and equities, and want to read the insights that are coming from the market. So, that, for example, include option traders who are trading SPX,
[03:03] 0DTEs, for example, futures trader trading ES and Q, stock traders trading could also be any any stock that are part of our
[03:15] coverage that are looking to get a clear understanding of what the data is telling us to potentially formulate better decision or limit the risk on their position. >> Why was such a huge redesign necessary?
[03:29] >> Yeah, so we basically launched Mentor Q about 3 years ago, and we've added a lot of feature with time, and the platform became really advanced, it became really vast, so we had a lot of really tools that we introduced from our
[03:44] volatility screener, our gamma levels, and so on. But, the problem is that the the product was very powerful, but we needed a workflow that could simplify things for traders. So, what we've done with 3.0 is really
[03:57] reduce the distance between research and trade decisions. So, we've integrated everything in one space. We've also added our charting application, and I know that a lot of active traders are living on chart.
[04:09] Before we didn't have that, so it was really hard to understand what was now re- re- re-redesign this, and now it's everything is overlaid in one single tool. So, you can go from really
[04:22] research to charting to plotting gamma levels on a chart, look at option data on a chart, and of course, then leverage our AI to potentially get an insight on >> So, there are a lot of new functionalities here, but maybe you
[04:39] could summarize the most important changes you have made. Especially, what is relevant for us as options traders? >> Yeah, absolutely. So, first for option traders, we've added real-time data, real-time gamma levels on indices like
[04:56] real-time gamma levels on indices like SPX, VIX, QQQ, and NDX, and the all 1,400 plus stocks that we cover. So, now update will update in real-time every 5 understand gamma structure throughout the day. Before, it was really every 30
[05:12] needed to move to a real-time infrastructure. Second, we've added real-time gamma levels on futures. So, as an option trader, this is very important because you can now capture the full flow of the
[05:26] market. So, if you're trading SPX, you can also see what's happening in the futures market, what's happening in the ETF space like spy. So, we have the first platform that is now bringing real-time gamma levels on
[05:38] futures by looking at futures options coming from the CME exchange. We cover all four of the exchanges, so you can now really use gamma levels on ES and NQ, but also crude oil, gold, soft commodities, forex futures, and so on.
[05:54] Uh then the next major development is really our charting experience. We've integrated the TradingView charting library and application. So now traders that are really using TradingView on a daily basis can find the same experience
[06:07] within the Mantle platform. Why did we do this? Because this allows us to then do this? Because this allows us to then power those charts with our data. So we developed a series of indicators that can now go live on your charts. Uh and
[06:20] now you can really uh and also the most important part is that they they update challenges we had in the past was really that because of some platform limitation, the updates were not coming as fast as needed. So now with our own
[06:34] infrastructure, we can control what's coming into uh your dashboard and your and your trading charts. And finally, I think uh uh some of the really cool things that we uh we released is really gamma levels backtesting.
[06:48] This is a a new feature that no one no other provider that we are aware of provides and is the ability for you to really understand how the level can hold really understand how the level can hold for the day and understand basically
[07:01] place a trade. So if you are an option trader, you want to understand what's the probability of a core resistance or a core wall to hold for the day because then you can structure your spread uh spread trades spread strategy
[07:15] accordingly, right? So you you want to trade with probability in your favor. So what we're delivering with our backtesting is exactly that. Uh we go kind of understand uh what could have happened in the past
[07:29] for the future. And then finally, really we empowered our AI tool Quinn to potentially give you the insights that you need to understand what's going on in the option chain market and uh real time.
[07:43] >> A lot of new function functionalities here, but let's start with the traders here, but let's start with the traders workflow. How will this upgrade improve the workflow of an options trader? >> Yeah, so I think the biggest improvement
[08:00] for an options trader workflow is that everything is now connected, right? So you can start the day by going into the the platform looking at for example how things have changed overnight when looking at SPX, QQQ, ES, and NQ. If
[08:16] you're an SPX trader, you can also look at what's happening in the future market. So you could potentially see how is the flow change on ES before the market opens, right? So you can monitor how things have changed overnight. You
[08:28] can also see basically directly on a chart how the price is moving in a real time towards really important gamma levels. For example, if the if the level, what's going on? How much gamma do we
[08:42] other strikes that should you be paying attention to? Then of course you can use the back test. So you can use the back test to say, "Okay, for example, if I'm an iron condor trader and I'm selling iron condors so core spread and put
[08:56] spread, I want to understand if we're in a volatile day because then I might want to manage my risk accordingly. If I'm a credit spread buyer or seller, then you can use our AI tools to potentially find trade ideas based on
[09:10] gamma based on option data and so on. So instead of having to go through five different tools, you can have everything connected in one place. >> So let's dig into the product. We don't
[09:23] have time of course to go through everything in this video, but we'll focus on four of the key changes that you mentioned. And let's start with real-time gamma levels on futures. What does that mean?
[09:36] >> Yeah, so basically for those who follow us who are already meant to be customers, we started producing gamma levels on futures by looking at futures options about a year and a half ago. Why did we choose futures? Because
[09:51] if you trade the markets, if you trade N Dax, futures are now becoming more and more important and the option volume on futures is growing. So as even as an N picture. As a futures trader, you're kind of left
[10:04] options, there's not really any tools out there insights by looking at actually the futures option chain. So we started this product about 2 years ago and at the beginning we were only doing end of day
[10:19] successful. A lot of our users loved it. We we really grew very fast on our futures community and futures traders. So we decided really with 3.0 to make a massive investment in data and
[10:33] partnership and we're now licensed with CME for CME, Comex, Nymex and Cbot. So you can now access really
[10:46] futures from different type of instruments from equities to commodities, sub commodities, rates, crypto and and it's all here. So for example here we're looking at the S but if you come
[11:00] into our futures section, you can see all our coverage. So we we're going to our forex futures, crude oil of course, sub commodities, sub commodities, copper, gold, silver. Obviously NQ, ES.
[11:15] Those are really the main one that our users will trade, Russell. But you also have a lot of really important commodities futures there. So now you can have option data updating live
[11:28] on all these futures contracts. So what we see here for example, is we're now running our Q-score on all our futures. Before, it was only on stocks and indices, so you can now understand how the four factors within our model
[11:43] work, so you can get an idea of where the price could be, how its volatility evolving, and obviously we have our seasonality score here. gamma uh as it evolved over time. So, for
[11:56] example, how much gamma is expiring today, how has gamma changed over the today, how has gamma changed over the past uh few weeks and months, and what's the expiration of gamma over the next uh few expirations over the next future.
[12:10] So, essentially, you're understanding are we in a very high gamma environment, what can be we expect for today. As a future trader, this is extremely important because it can really dictate the the the the
[12:25] stop-loss or the take-profit that you can use based on different gamma levels. Uh then, of course, we have our volatility measure. This can be really helpful for futures traders and option trader. We now have our
[12:37] uh VRP, uh volatility risk premium, our skew, and our term structure directly on futures, so you can really uh get an understanding of what's going on here. This is very important again, uh this updates intraday, real-time every 5
[12:53] minutes, so you can actually understand where the flow is going, how the flow is uh what has changed over the past day and the past hour, so you can understand how is the price reacting to changes in
[13:05] option flow, and then of course, we have also our change in volume and so on. So, this is really important and really uh beneficial for any type of future trader that are looking at the future market, as well.
[13:21] >> And let's move to to the second key change, which is um the changes you made to your charting and the where where you have an agreement with the TradingView. Describe this very very
[13:33] quickly. >> Yes, absolutely. So, uh, one of the, uh, things we were missing in uh, in our previous version was really the ability to plot prices and data on a chart. So, what we've done is really we've, uh,
[13:47] uh, signed an agreement with TradingView where we are now, uh, integrated their charting library directly into our system. And the reason why we chose one of the best charting platform in the
[13:59] world and is really the one that is mostly used by, uh, any active retail trader. So, basically, you are getting the same experience, exactly the same standalone TradingView chart directly into the app. Uh, why is that important?
[14:14] Because now, um, you're you're going to be able to overlay, uh, all our indicators and our gamma levels and these will update in real time. So, for example, if you wanted to move to intraday data and, uh, you wanted to add
[14:28] a lot of different indicators, then you could do that, uh, directly into our chart. So, here, for example, these are, uh, some of our proprietary indicator, but you also have access to all the different uh, technical indicators, so
[14:41] 150 plus indicator that TradingView already offers directly into the app. plotting our skew, we are plotting our implied volatility, and then we are plotting our gamma levels, right? So, uh, all of this can change real time and
[14:57] it's all interconnected uh, directly into the app. So, everything is really there so you can create your watch list, you can look at different gamma levels, you can look at different uh, tool. You can also use all the drawing tools
[15:09] available on the typical TradingView application and then if everything is there for you. So, you can monitor really uh, things that are changing throughout the day real time directly onto onto the
[15:21] >> Do you need to have a separate TradingView subscription to benefit from this? >> No. So, we we've integrated the their license. So, as a Market user, you get this integrated. There's no additional
[15:35] basically all the different indicators that TradingView provides standalone plus all our indicators. Yeah. So, everything is now in in one place. And there's no limit on the amount of indicators that
[15:51] you can run because we control exactly what you can see and what you can access on the platform. >> The third big change is backtesting of >> The third big change is backtesting of gamma levels. What is this?
[16:04] >> So, basically, one of the biggest challenge and question that we were getting from our users over the past few years was okay, I see a lot of the gamma levels. I see they are very strong support resistance magnet zones. But how
[16:21] can I access first historical data? Second, how can I know if a level will hold for the day? So, basically, when I come in and I don't I haven't seen your data in the past, like, how can I be rely on that data and how can I
[16:36] use it to formulate my my trading decisions? So, what we've done is really we've created our backtesting tool. So, the backtesting tool is now available on the app as well as on the charts. So, we're going to go into the chart in a
[16:51] second. Essentially, what we are backtesting is three levels on the upper side. So, our one-day max, our core resistance, and our core resistance 0 V D. So, we want to understand, okay, if we look at all
[17:03] expiration, this is our core resistance. How is that level performing? And now, what's the probability of success today? One-day max is really our is our indicator which has a very powerful success rate. And how can you use that?
[17:17] You can use that as an option trader if you want to find the strikes where the price might not be at the end of the day. So, for zero DTEs, uh option trader future trader. So, if you want to spot for reversal when we approach the one
[17:33] for a reversal trade. And now with a backtest, you're also going to be able to get a better understanding of what could happen. So, to the downside, we are now backtesting our put support with support zero DTE and one day min, right?
[17:48] So, essentially by clicking on this level here, uh you can basically uh go down below, and you can see the result. So, here we are looking at 3 years of data. I don't know if you can see it here. Uh it's a little clearer, but
[18:02] we're going back about 3 years of uh of past data, and we're looking at outcomes in a similar market condition, right? So, we want to see because in order to have a good backtest result, you want to see what could happen today based on
[18:16] similar market condition. So, in similar market condition, we've been in a similar market condition 362 times. On 91% of the times, the price uh closed day, right? When that doesn't, then we go to
[18:31] the section below, which is showing us basically when we broke intraday, so when we broke the level during the day, there's a 55% When we don't come back, the average move below is about 36 points, and the
[18:47] worst move 170 points. This was probably one of the uh tariffs announcement last year. When we When we closed uh basically uh uh when we broke at the close, so in the last 8.7% of the times or 9.7% of the
[19:04] time, so this is the difference between the 91.26 and 100. So, on 8.7% of the time, we closed below the one day mean at the close and the median move is 34 points. The average move is
[19:18] 43 points and the worst move is 165 points. So now you have really some clear understanding on what could happen if the level holds and what could happen when the level does hold. So now maybe I can go into the chart and
[19:34] we can actually look at it directly here. So one of the First one of the things that we've introduced is the ability to look at historical gamma levels. So you can actually go back in previous 30
[19:49] days and see how the different gamma levels have performed. Right? So this is really historical gamma levels. This is telling you, "Okay, so I want to see yesterday how the core resistance reacted to the price." And you can see
[20:03] that. But then we've added also another indicator which is really our gamma levels back test. So here what we have here is the same table that we saw before. So this would be our core resistance. This would be
[20:18] our one day mean data. And in the chart, and I'm going to explain very simple how to use it, we can now go into the settings and we can plot one upper level to the upside. So it's either going to be the one day max or resistance and
[20:32] core resistance yield to eat. And then one level to the to the downside. Right? Why do we do that? And then what we're plotting here is the average, the median, and the worst. Right? And let me show you how this
[20:44] works. Right? So for example here we are plotting our core resistance right here. Um the price obviously open
[20:56] below the core resistance. So as let's take this example as an option trader directional trader. So as an option trader I believe that we are in a down day and I believe this level could be strong is a 7,500 level.
[21:13] We can also now overlay our Jack's data directly on the charts so we can really quickly see the amount of gamma expiring at this level here. Core resistance right there. And then basically
[21:29] we can define our our plan. So let's imagine that uh we believe that this level could hold. We could use this area here which is the medium and the average either as our stride to the upside or as our stop
[21:45] target. So if I'm credit spread seller, I could use this credit spread seller, I could use this data this level as my target. If I'm a directional trader, so let's imagine that the price moves towards this area.
[21:59] I believe that this level will hold. I could use this level as my stop. I could plan a short entry and then I could have basically a secondary stop loss right here. In the in the area right there. >> All right. This is exciting exciting
[22:14] stuff. And the fourth change we're going to demo is what you have done to your AI which you called Queen. What is What is Queen and what makes it different than a normal AI chatbot?
[22:28] quantitative intelligence and we released Queen at the beginning of the year. So Queen is really our AI engine. year. So Queen is really our AI engine. With 3.0 we've now expanded the coverage
[22:40] and expanded the models and it's now covering futures as well. So let me clear. Queen is not just a chatbot, right? And we can we can see it here. Queen is actually a tool that is completely integrated in our data and
[22:53] insights on our internal data, market news, market intelligence and analysis. So it's really not just a you. It can also do but we feed Queen in with
[23:08] a lot of our internal documentation, our models, and most importantly, our data. So, for example, if we go here in our charts, some of the cool things that you can ask is really how does the data change over
[23:21] time? So, for an option trader or a future trader, you want to understand how the levels have moved. So, this really Queen is accessing our historical data and is giving you insight. Queen can also give you
[23:34] a trading roadmap. So, it can also give you a trading plan by looking at the data. What are the key levels that you can look for? So, here we're looking, for example, at NQ and we're running a full market analysis. We're looking at
[23:49] our Q-score. We're looking at dealer positioning. We're looking at the strike prices, jacks, um where the levels are, secondary levels, blind spots, implied volatility, so breakdown by DTE.
[24:05] So, as an option trader, this can be very, very useful and important. And very, very useful and important. And then, of course, you have a real-time trading roadmap. What are the things that are supporting our idea? What are
[24:17] Some of the things that we should be paying attention to. And it's all right there for you. And then, of course, we have real-time news on top of that. So, I think that the most important part is really Queen can be your trading
[24:32] use to understand what's going on in the market. >> Fabio, this new platform is being launched as we publish this video, but you have, of course, been able to test this for for a while yourself and you
[24:46] this for for a while yourself and you are avid trader yourself. So, what is are avid trader yourself. So, what is your your typical workflow with with the new platform? You know, how how does what what does a typical trading day
[24:59] >> Yeah, so I think what we've done I think with the platform and we're very happy, we're very excited about it is really that we we now have everything connected together. So, a typical trading day for me would be to start the morning maybe
[25:13] 7:00 7:30, look at the market, look at the futures data. Before we only had end of day, so now I can monitor basically the overnight activity. I can see how flow has changed overnight before the New
[25:27] has changed overnight before the New York market open. I can now look at SPX, York market open. I can now look at SPX, QQQ, VIX together with ES and Q to see how things have changed, so to see how flow has changed to potentially predict
[25:39] what could happen at the open and the volatility for the day. now and I can see okay, like if I'm a spread strategy for day I think it's going to be a not a volatile day and I
[25:52] want to do some credit spread, then I can look at my backtesting and I can see what's the probability of levels to hold for the day. So, I can plan my trade accordingly, especially my risk. And then finally, I can actually use
[26:04] And then finally, I can actually use screen to go over recent news, go over recent change in data, and start screening for opportunities for the day. as an option trader, I do a lot of like swing trade, so I look for really
[26:17] interesting plays that I can hold for about 5 to 20 days in the future. So, I can use screen, I can use our swing model to potentially find those trade ideas. >> Let's sum up. What would be the two or
[26:31] three most important takeaways that you really want the audience to remember from this interview? >> Yeah, so first I think really we are the first platform that has released real-time gamma levels looking
[26:45] at futures options, so I think this is a major upgrade. We're super excited about platform that is now doing gamma levels back testing directly on the app. And third, of course, we have really enhanced our AI capabilities. So,
[27:00] you can now really leverage the same data directly through the AI. So, I think those would be the the takeaways. Really, real-time infrastructure, real-time data, futures coverage, back testing, and AI.
[27:14] >> And people can test this out. Do you believe you offer a free trial? >> Yes, we we do. You can create a free account, and you can access you can test it out. You can access also Queen for free for a certain amount of queries,
[27:30] well. >> And if you decide to continue, there are >> And if you decide to continue, there are currently very good discounts if you use currently very good discounts if you use the link that you see on on the screen.
[27:43] 50-60% discount compared to the normal price. So, it is a good time to to try it out now if this is something that is of interest to you. >> Fabio, thank you very much for sharing all the changes, exciting changes that
[28:00] you have brought to to your platform. >> Yeah, and thank you so much for having me, and great work on your channel and all your content. I was very happy to be part of your live a few weeks ago, a few months ago, and I'm very excited to see
[28:13] you so much. >> Thank you.
⚡ Saved you 0h 28m reading this? Transcribe any YouTube video for free — no signup needed.