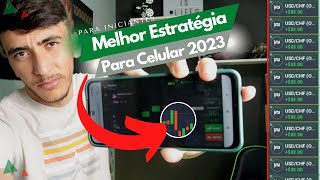

Trade Binary Options on Mobile
45sAddresses a common pain point—trading without a computer—with a relatable, encouraging tone.
▶ Play Clip"The title accurately promises a mobile trading guide for IQ Option, and the video delivers exactly that."
This video teaches beginners how to trade binary options on IQ Option using a mobile phone, focusing on the 'Bubble Bands' strategy. The presenter explains how to set up the chart, apply the indicator, and execute trades based on breakouts, while emphasizing the importance of trend filtering and discipline.
The video addresses traders who lack a computer and want to trade binary options via mobile phone using the Bubble Bands strategy.
The presenter prefers trading through a mobile browser over the IQ Option app due to better connection stability and lighter performance.
Change the chart type from line to candlestick by selecting the first option on the left. The default timeframe is M1, but M5 or M15 are recommended for better accuracy.
Go to the second option on the lower left, click 'Indicators', search for 'bands', select 'Bollinger Bands', and set period to 20 and deviation to 2.
When a candle breaks the upper or lower Bollinger Band, place a trade in the direction of the breakout at the end of the current candle, targeting the end of the next candle.
Zoom out to identify the macro trend. Only take sell trades in a downtrend and buy trades in an uptrend. The micro trend may differ, but the macro trend prevails.
In an uptrend, when the candle touches or breaks the lower band, place a buy order. The presenter shows a trade on EUR/JPY with a 5-minute expiry.
The trade won by a small margin. Patience and discipline are crucial; entering too early can lead to losses.
To switch to M15, click on the current timeframe (e.g., 5 minutes) and select the desired option. M1, M5, and M15 are the most used.
The Bubble Bands strategy is a simple yet effective method for beginners to trade binary options on mobile. Success depends on following the trend filter and maintaining strict discipline in trade execution.
What is the recommended timeframe for better accuracy in the Bubble Bands strategy?
M5 or M15.
02:35
What are the settings for the Bollinger Bands indicator in this strategy?
Period 20, deviation 2.
03:58
When should you place a trade according to the Bubble Bands strategy?
When a candle breaks the upper or lower band, place a trade at the end of that candle for the next candle's expiry.
04:36
What is the trend filter rule?
Only take sell trades in a downtrend and buy trades in an uptrend, based on the macro trend.
05:36
Why does the presenter prefer trading through a browser over the IQ Option app?
Because the browser connection is more stable and lighter.
00:43
Core Strategy Rule
Defines the exact entry condition for the Bubble Bands strategy.
04:36Trend Filter Importance
Emphasizes trading only with the macro trend to increase accuracy.
05:36Discipline Wins
Shows that patience in waiting for the correct candle close can turn a losing trade into a winner.
10:11[00:02] starting out in the binary options market and wanting to trade via mobile phone. So, in this video, I'm going to teach you how to trade on IQ Option using your mobile phone. I've already shown you this strategy, and I think it was in the last video
[00:17] I posted where I taught you how to trade via computer. However, I know that many people don't have a computer available to trade. Without a doubt, it's better to trade via computer. However, many people do
[00:29] n't have one, so there's nothing to do but have a mobile phone, and that's it. You work with what you have until you one day achieve what you want, simple as that. Let's go! Look, the name of this strategy is " bubble bands," and
[00:43] here I am trading through the browser. It's possible to trade through a browser on a mobile phone, but if you want, you can also download the IQ Option app. I do n't like trading
[00:56] through the app because you need a connection that's not very good, you know? In a case where you do n't have as much speed, I think it's much better to have a connection through the browser. It's much lighter and performs the operations
[01:11] grab an account, do some operations there just to see the delay issue. You'll choose and decide. We'll leave links for you to operate through the browser as well as through the app. We'll
[01:26] also leave a link if you want to download the app. Let's go, the name of this strategy is called "bubble bands," okay? It I brought, if I'm not mistaken, it's the last video, and I'm going to teach everything here using the
[01:40] First thing is, if you're not subscribed, subscribe to the channel quickly and activate the bell to receive all our content. Every week I bring new content, and I bring a lot of things, so if you leave
[01:53] Soon, God willing, my training will be released, in case you operate through a strategy that... if you browse my channel, give it but without further ado, let's get to what matters. Look, first thing, you're
[02:07] going to come here to the left side, the bottom. But before, when you your chart might look like this, the line chart. you simply go to the first option and change it to a
[02:22] candlestick chart. Okay, you've set it to a candlestick chart. You can see it looks like this. Here we are on the M1 chart, but I'm going to switch to the M1 chart, but I'm going to switch to the M5 chart. Okay, you can
[02:35] M5 chart. Okay, you can also trade on the M1 or M5 chart, I don't know which one you choose. The longer the timeframe, if you trade, for example, on M1, you can trade on M1. Yes, you can, but M1 will present many opportunities, but these
[02:49] opportunities will have a little less accuracy than M15. If, five, you will have a little more accuracy than none, but it will opportunity to arise. The same thing happens if you decide to trade on M15; it will
[03:05] take a little longer for the opportunity to arise, but it will be a little more accurate than M5 as well. So it's a trade-off; you'll adapt. Try it out on your account when... If you feel comfortable, you can
[03:17] as I said, is a very simple strategy, okay folks? For those of you who are starting out, you might understand, maybe even convince yourselves that it's possible to make money in this market, and perhaps be, how can I say, improving more, taking another,
[03:32] more complete strategy, and maybe even here is simple and easy for those who are starting out, okay? Let's go. First the ball pattern indicator, and it's very simple. On the lower left side,
[03:45] you'll go to the second option, click on indicators. Look at this little option here, leave a little arrow so you can see it. In search thing I taught in the previous video, bands. Put
[03:58] bands here, and it will appear here, little ball bands. You'll click, and the configuration is also exactly the same: period, you'll put 20, deviation, you'll leave two. Okay, so this is also the configuration through the cell phone. Okay,
[04:12] in the financial market, nothing changes, folks, both computer and cell phone, it's the same thing, absolutely nothing changes here in display colors. Okay, if you want to change the color, it's here. It's just for visualization purposes; it doesn't change the
[04:24] example, I like to leave it white here; it's more visible both for me and for you watching the video. Okay, so click here, everything's okay, all the lines are white. Click here to apply, and look what was added
[04:36] to our chart: three lines, right? The bottom line, the center line, the middle line, and the top line. How does this strategy work? It's very simple: every time it breaks through, in this case, every time the candle breaks
[04:51] our line, both upper and lower, we execute pressure towards the end of the next candle. For example, here was an example of an opportunity where we would have a win. You can see that this little green candle here
[05:05] clearly broke the upper line, and the next candle was a lower candle. So, at the end of this big green one, we it finishes, if we open a trade towards the end of the next M5 candle, okay?
[05:20] Here we are on the M5 chart. Okay, folks, I'm going to do a trade operate in none, in five, in 15, you choose, okay, let's go. As soon as show you. Okay, there's also a filter, which is the
[05:36] trend filter. It's very simple. You go here to your phone screen and move it like this: to zoom in, it enlarges everything. See? Now, if I decrease, do the opposite, the opposite movement will decrease
[05:48] is in an uptrend or downtrend. Okay? That is, there are more people buying, more people selling. So, a very interesting filter here. Clearly, I see that there is a downtrend because the chart is falling. So it's very
[06:02] simple to identify, very simple indeed. So, if the chart is falling here, it means that we only do sell operations. Okay, I identified here that both the macro, which is the larger macro trend, this big one
[06:15] here, and the micro trend, which is this when we zoom in on the chart and only see the one on the screen, so in the macro trend it's down. So in the macro trend it's down, and the micro trend, look, you can see here, if
[06:31] we observe, it's a micro trend, that is, a There's a slight upward trend. However, what predominates here is the downward trend. So here in the Euro GBP, we're only going to execute sell orders. That
[06:44] is, every time the candle breaks the upper line, we execute a sell order. So as soon as an opportunity appears, I'll come back here with you so we can execute the operation for you to learn properly. Okay,
[06:56] as soon as the opportunity appears, I'll come back here with you. Look, folks, here's an opportunity in the Euro JPY. You can see what it's trying to break through; in this case, the line is lower. We're in an
[07:10] upward trend. So, okay, here we can make a buy order. If it breaks through or at least touches the line, we'll access the end of the next one. I 'll leave the value prepared here;
[07:33] So here we'll put it at five. If this operation is successful, it will end at 4:25 pm because this candle that's 4:25 pm because this candle that's moving will end at 4:20
[07:48] pm. So if it ends at 4:20 pm... 20 we executed the operation for the end of the next one, so in a case of 16 and 20 plus five minutes, but it's exactly 16:25, it's very close,
[08:05] very close indeed, so operation, okay, I made the entry, that is, this next candle here, for us to have a win, it needs to finish green, that is, be a bullish candle, let's see what
[08:22] be a bullish candle, let's see what the result will be
[08:37] that sometimes it moves downwards, so here it's showing a loss, it doesn't matter, it can move a little downwards, what really matters is when it finishes, okay, it has to finish on top of our analysis,
[08:49] now for example, it's showing red, so we're having a loss, but the problem, we don't lose anything with that, just that until the operation finishes, until 16:25, this candle has to finish this color, okay,
[09:05] let's see what the result of this operation will be
[10:11] can see it was by a very small margin, that's why it 's important to execute the operation where you have to execute it. If I were, for example, hasty and wanted to get it before, I would have had a defeat because it was by a very small margin.
[10:23] operational discipline, that's why many people get lost sometimes, they get too apprehensive, right? They get anxious, they want to do things before the time they actually have to do them. But let's go. Another thing, if you want to change, which
[10:38] like the video for beginners here, in this case a cell phone, to change the time frame, that is, to operate, for example, on M15, you come here to this second option where it says 5 minutes, click, and here I can change, for example, to one minute.
[10:52] So I click, and it automatically changes to the one-minute chart, okay folks? So each candle here has a one-minute chart time frame. If we has a 5-minute chart time frame. That's what the chart time frame means.
[11:07] If I put, for example, M15 here, then these are the three most used charts. In the M1N5 M15, here in the case of 15, each of these little old ladies has a 15-minute timeframe, okay guys, so there you have it, another video using the little
[11:23] dot bands, which is a phenomenal trading tool. The dot bands, previous video, I use in my main trading strategy, through an indicator that I use both as a filter and as a trigger. So it's very
[11:37] interesting, who knows, maybe one day you'll also advance, maybe you'll build your own trading strategy using the dot bands, for example, I use them through an indicator, who knows, maybe one day you'll also be advancing, right, taking
[11:50] more complex strategy and maybe turning the key, wonderful market. Okay, so once again, thank you very much. Any questions, leave them in the comments. If you're not subscribed, subscribe and activate the
[12:04] content. And that's it, bye, leave a like too, and thanks, see you in the next video, bye bye. too, and thanks, see you in the next video, bye bye.
⚡ Saved you 0h 12m reading this? Transcribe any YouTube video for free — no signup needed.