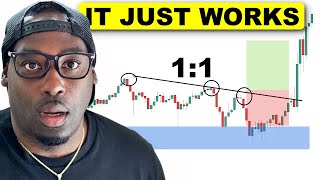

Why Context is King in Trading
56sUses a relatable analogy (punching someone) to explain a core trading concept, making it memorable and shareable.
▶ Play Clip"Delivers a clear, actionable trading system in under 16 minutes, though some parts are repetitive."
This video presents a straightforward, systematic approach to day trading, emphasizing the importance of market context, higher timeframe direction, and the use of five-minute chart levels for entries and exits. The presenter advocates for simplicity, discouraging overcomplication and jargon, and demonstrates the method with real trade examples.
The video starts by highlighting the necessity of having a specific, repeatable system for daily trading to become a better or profitable trader.
Before trading, one must understand the market context. Using an analogy of punching someone in self-defense, the presenter explains that the same action can be right or wrong depending on the situation. In trading, context determines whether to buy or sell.
The first step is to look at the daily chart to determine the overall trend. For example, if the NASDAQ is holding a trend line and moving up, the bias is bullish.
After determining direction, plot key levels such as swing highs and lows on the daily chart. These are areas where potential buyers or sellers might enter.
Daily demand zones are often too large for day trading, as the market might react anywhere within the zone. A five-minute chart provides more precise levels.
After identifying direction and levels on higher timeframes, drop to a lower timeframe (e.g., 5-minute) for entry signals like trend line breaks or strong candles.
Even when using daily levels, the entry is executed on the 5-minute chart, looking for reactions or trend line breaks at those levels.
Targets can be fixed risk-reward ratios (e.g., 1:2) or based on previous levels. The presenter suggests backtesting to find what works, noting that sometimes the market won't reach the target.
If the daily chart doesn't provide enough levels, the 1-hour chart can be used to mark swing highs/lows and supply/demand zones.
The presenter prefers to strictly use the 5-minute chart for both direction and levels, as its direction is usually sufficient for daily profits.
Based on backtesting, a 1:2 risk-reward ratio is a good sweet spot for 5-minute chart trading, though some days allow for larger moves.
Another example shows a market consolidating, breaking out, and returning to a level, providing a selling opportunity with a stop loss above a swing high and target at support.
The presenter criticizes those who complicate trading with jargon, noting that terms like 'liquidity sweep' are essentially the same as support/resistance. Simplicity is key.
A downtrend on the 5-minute chart with a trend line break and a supply level provides a short entry with a stop loss above the level and target at support.
A level that is tested twice (double test) can be used for entry, or one can enter on strong buying momentum for a quick scalp.
There are many valid approaches; the presenter advises not to be confused by others claiming their way is best. Keep it simple and backtest.
A trade where the market faced resistance, broke a key level, and the presenter shorted, resulting in a 2:1 reward and $4,300 profit.
Another trade using a swing low on the 5-minute chart as support, entering on a bullish bar, and taking profit at the high for $2,600.
Understanding context boosts confidence and clarity. Backtest extensively, work on emotions, and study to master the approach.
The video concludes that a simple, systematic approach focusing on context, higher timeframe direction, and 5-minute chart levels can lead to consistent trading. The key is to backtest, manage emotions, and avoid overcomplicating the process.
What is the first thing to understand before trading?
Market context.
00:15
What does the presenter use to determine market direction?
The daily chart.
01:52
Why are daily demand zones not ideal for day trading?
They are too large; the market might react anywhere within the zone.
03:11
What is the recommended risk-reward ratio for 5-minute chart trading?
1:2.
08:53
What is the presenter's view on complex trading jargon?
It's unnecessary; terms like 'liquidity sweep' are the same as support/resistance.
10:48
What are two entry signals mentioned?
Trend line breaks and strong candles.
04:24
What is the purpose of backtesting?
To figure out what works for you and find a sweet spot for targets.
13:03
Context is King
Establishes the core principle that trading decisions depend on the situation, not just the setup.
00:15Daily Zones Too Wide
Explains why lower timeframes are necessary for precise entries.
03:11Strictly 5-Minute Chart
Simplifies the approach, showing that a single timeframe can be sufficient.
07:43Jargon is Unnecessary
Challenges the complexity in trading education, promoting simplicity.
10:48Real Trade: $4,300 Profit
Provides concrete evidence of the strategy's effectiveness.
13:43[00:02] don't have a specific system that you follow every single day. And today, I'm going to help you come up with a system so you can follow it every single day. So hopefully you can actually become a better trader or profitable or gain more
[00:15] market. So the first thing you need right when you are looking at the market before you trade, you have to understand the context, right? Context is king. So what is context? Well, let me ask you a question. If I say, "Hey, should you go
[00:31] and punch a random guy in the face?" And I hope you say no. You know, like, you go up and punch a random person in the face, right? Well, what if I say, "What if that random person came to you first,
[00:45] started picking on you, and then attack you, and all you trying to do is defend him in his face?" Now, if I gave you those details, would your answer change? would say, "Yeah, you know what? Yeah, if I had to defend myself, yeah, most
[00:58] likely I would punch a stranger in the face, right? So that's what we are doing when it comes to context, right? It depends on the situation. Same thing with trading. So good example would be let's go to the chart. If the market is
[01:12] trending up, right? And basically I say, is it a good place to buy right here? And your answer would probably be yes. You know, we we we want to go long because the market is trending up. Okay?
[01:24] So, you want to be a buyer. Now, what if I say, "Well, it's a resistance right I say, "Well, it's a resistance right here." Now, is it a good time to go long? Again, your answer might change and be like, "No, I don't think so now
[01:38] Sellers might come in and we might get stopped out." So, that's what context is all about. It depends on the situation. day. We're looking at the context. We're looking at what's the market doing right
[01:52] now. Why do we want to be a buyer and why do we want to be a seller? Okay. the context, right? Looking at the structure is, you know, looking at the bigger picture. So, you can look at the
[02:04] chart real quick. All right. So, the daily chart, here's the, you know, daily chart on the NASDAQ, right? And overall, the way I would look at the daily chart the market is bullish. Look at this. It's holding these, you know, this trend
[02:17] line as the market is bullish. It's just going up. Okay, fine. So we know the going up. Okay, fine. So we know the direction. Now the next step is to plot to plot levels is because you know we want to look for a specific area on the
[02:31] chart where potential buyers or sellers might come in the market and hopefully if we participate or if they participate around those areas we can actually make profit. So I would look at you know the major swing highs and lows at on daily
[02:45] chart. So we can you know mark down right here. Okay. mark down this swing low. Um, you know, we can mark down swing highs if it comes, you know, above the swing high and, you know, maybe we can get a buy over here. Um, we can even
[02:59] sometimes do a demand level on a, you know, daily chart. I don't like doing it because overall the man levels are so big on a daily chart. Uh, let me go to five minute charts to show you what I mean.
[03:11] So, right here, right, this is the demand on a daily chart. Um, look how big this is. Okay, if you if we're day trading, we don't know if the market trading, we don't know if the market will react to the top of the daily zone
[03:24] or the middle or the you know bottom of it or even right here. So it's like we we going there's so much you know space right here. So this example though if you look at this look how the market reacts to this demand zone. Now, this is
[03:39] a picture perfect, you know, scenario where we would want every single time it telling you right now, it doesn't work like this. Okay? But this is a great like this. Okay? But this is a great example of having the market react to
[03:53] frame. This is the five-minute chart. And actually, it's creating a lot of buying and then is creating a demand level on the five minute chart. And we want to attack. Okay. So the first thing is we want to look at the direction and
[04:09] we can look at the direction on the higher time frame. Next thing we want to plot our levels and then from there we want to go on a lower time frame to get in. Okay. So um how do we want to get in? Well we can get in a simple maybe if
[04:24] the market is has a trend line we get on a trend line break. Okay. So the market breaks the trend line or we can look for a strong candle or some type of double Okay. I'm just keeping it simple and also you can look for volume coming in
[04:37] the market, but we're going to keep it simple right here. So, right here, we do have a nice uh solid green candle right here or we have a trend line break to the upside. Now, let's go back to the daily chart. Okay, so the thing with the
[04:51] daily chart. Okay, so the thing with the daily chart is it doesn't provide enough levels every single day for me to attack. Okay. So, right here I just marked maybe one level right here. Another level right here. So, this is
[05:05] three levels. But from here to here, that's like, you know, almost two months. So, we only get what? 1 2 3 four opportunities within two months. That's not a lot. So, that's why um we might have to go to a lower time frame. But
[05:20] let's look at this daily level right here. Okay, let's go to the 5minut chart here. Where is that daily level? It's right here. So, how would we had you know enter this level? Well, basically um it reacted right here and it shot up.
[05:36] It definitely created a demand level right here, right? But to me, this would right here, right? But to me, this would be a nice little entry right here. Or let's say that it came back over here. We didn't really get a good entry right
[05:49] here, but guess what? What do we see? A nice little trend line break. Okay? And we can get in right here after that trend line break. and we're looking for, trend line break. and we're looking for, you know, rewards. Now, how long or what
[06:03] is the best target, right, when it comes to getting in the market? Well, you can do fixed rewards like a one to two, meaning two times your money, or you can meaning two times your money, or you can look for previous levels or levels in
[06:17] here, what do we have? What level do we have right here? We have a resistance level right here. So, we can say, you know what, I want to target this level. Here's the thing, okay? Sometimes it will never go to that level. Okay? You
[06:30] that level." But guess what? The market doesn't care what you think. Okay? So, we could say, you know what, maybe we could take off half right here or some ride. Or you can say, you know what, let me back test
[06:47] in general or on average how much the market moves. Okay? So, let's say on average the market moves 70% 2:1. Okay? So maybe you say, you know what, I'm single time. I don't got time for this because sometimes it will go up and then
[07:02] come right back to go back to my break even stop. So it all depends on you, know, what you want and it depends on how you back test the market. Now when I daily chart doesn't provide a lot, you know, a lot of levels. So how do we get
[07:17] levels every single day? Well, you can go to let's say the 1 hour chart, right? So the 1 hour chart, you can get levels that um, you know, the market has. You can, you know, go on the one hour chart and just mark down these swing highs,
[07:29] these swing lows, right, on the one hour chart. Even you can mark down, you know, maybe some supply and demand levels on the the 1 hour, you know, and go from there. So, you can use the 1 hour for levels, too, right? But I'm going to
[07:43] tell you what I do. Okay? What I like to do is I just like to strictly go to the five-minute chart. All right? So, here's the five-minute chart. And this is what five-minute levels because the five-minute chart, what I noticed is
[07:57] that the five-minute chart, the direction of the five-minute chart is direction of the five-minute chart is usually good enough to make profits for the day. Okay? So, we don't really need the big macro, you know, direction
[08:11] because if you looking at the five minute chart, the five minute chart can give you direction and not only give you direction, it could also give you levels say market is going up right here. We can look at potential levels where the
[08:25] market come here on the five minute chart and we can get in participate to go up. So here's a good example of where the market break this triangle right here and it's just trending up. So what do we have right here? We have nice
[08:37] demand level right here. Okay. So if it comes back to this level right here, we strictly five minute levels because now we know the direction, right? And we and boom, we're looking to get in. Again, how much profit do you want from
[08:53] the market? For me, based on my back testing, a good sweet spot is one to testing, a good sweet spot is one to two. But there are days where, man, this thing go one to three to four and so on. Okay? So, if you're trading a fivem
[09:07] minute chart, a good sweet spot is one to two, but there are days where you can hold much longer. And those days are usually reversal days and sometimes trending days where you're going to hold much longer. So let me show you guys
[09:20] another example of just using the 5minute chart. So here's the next day where the market is consolidating and then all of a sudden it breaks out right here and then it comes back to this level and all of a sudden we have the
[09:35] market reacting to this level right here. Then again we can get in uh with a candlestick. So we we can we have sellers coming in right here. We can get selling right here. And you can also put your stop loss either above a swing low,
[09:50] swing high or above the candle, right? And you can look for your fix maybe one to two or again if you feel like this is a trending market, you can look for more. And we we can target again we can target, you know, potential levels where
[10:04] we have support around here. So we have support around here. So we can target these levels right here for uh potential target profits or we can get in in a break right here. Okay. So if you see that nice trend line break, boom, get in
[10:19] the market and get in. Right? Again, we we want to try to keep things as simple right now, look online. You want to see people literally trying to complicate uh trading. They're going to try to make it like they are I don't know. It's just
[10:34] like they they change the language when it comes to uh trading and they try to make it I guess they try to make themselves sound smart. So they use big words. They reword a lot of things that's you know been going on. Like for
[10:48] example a lot of people I remember this guy was like man you still use support and resistance but that's basic. And I'm I'm just shaking in my head like, man, he has no idea. Like support and resistance and these other terms like
[11:02] liquidity uh sweep is literally the same thing, right? I can show you so many examples of me taking a resistance trade or support trade, but you would call it or support trade, but you would call it a liquidity sweep. So me personally, I
[11:15] just try to keep it as simple as possible and and go from there. So let's let's go to the next day right here. And right here, what we have? We have the market trending down on the five minute chart. So the fivem minute direction is
[11:27] down. We have a trend line break and then also we have a nice little level right here. Okay, which is a supply level. And then we have nice double reaction. Okay, so we have a nice bear bar and we can just get in when we see a
[11:42] lot of selling going in. Again, we can put our stop loss above it. It's always if you want to be safe, it's always great to put your stop loss above some to keep it tight, you could keep it tight. You could put it, you know, above
[11:55] candle, whatever. And then, you know, look for again a fixed target or you could look for maybe you could look to the left to target maybe a support level like right here. Okay, that could be one of your targets and so on. Right? So
[12:10] again, get in like that or you get in with a trend line. Okay, fine break, right here. So right here, the market just shot up the fivem minute level. Uh what do we see? Basically, this is where the market open. It shot up. So, we have
[12:25] this level, right? It give you a double test, too. So, you get in, you know, after see double test or you can just get in right when you see a lot of buying going on. Okay? So, this one right here, I remember getting in with
[12:38] this one on a one minute chart, which is a quick scalp to the upside. Okay? But this one, you know, when you see the buying coming in, you can look in, get buying coming in, you can look in, get in, okay, hit that level and and you can
[12:51] go for that quick scalp. Uh, one thing you can do is, let's say it goes to a one to one and doesn't go to a 2 to1, you could you go to you you could go to break even or you can say, you know what, I'mma hold. If it doesn't go to my
[13:03] TP, I'm going still hold, you know, and sometimes you might get stop stopped have to back testing to figure out what works for you and go on. So that is how I'm looking at the market every single day. Guys, there are so many ways to
[13:17] right now, guys, do not let people confuse you. Do not let somebody say, "Oh, my way is the best way." There are so many different ways to um look at the market. The only thing I can tell you is try to keep it as simple as possible.
[13:30] Okay? So, let me get just show you one more example. Here's uh you know a market is ranging and it's not doing up and down. So, the way you attack this market is you can, you know, short the
[13:43] me show you a couple of quick trades that I took and uh we're gonna go from there. All right. So, here's a day where the market was going up, right? And if you look to the left, we have what? This resistance. Now, the market went up
[13:59] remember, we have a lot of selling going on right here. Okay? So when it comes possibility that it it won't break you know above it because we have sellers around here. So pre-market we had a hard time going above this area right here
[14:14] and then we broke this right here this key level right here and then that's key level right here and then that's when I participate cuz we had this level and then also we had this swing high right here. So I went short right here.
[14:27] Okay, I didn't record this trade but let me show you guys the broker statement. Basically, this was a nice two to one right here. And I made uh 4,300 on this trade right here. Okay. So, let me show you another trade. Okay. So, here's
[14:40] another trade. This is the 5minute chart. This again strictly using the market went up. We broke, you know, this level right here. And we was just trending up. Okay. So, the market trend up, came back. I wanted this I really
[14:53] we didn't really pull back all the way to this level right here. But I used this swing low right here to get in. Okay? Because again these swing lows are levels on the fiveminut chart to get in. So I saw this swing level. I saw that we
[15:07] have this bulls bar coming in. Basically also drawing a trend line. So look like I'm in this market. Let me show you guys this quick recording. So right here you see that I'm in the market and basically the market is going up and I'm just
[15:21] looking for my profits. So overall everything's looking good. It doesn't not really worried about this trade. So let me fast forward this. All right. So, everything's looking good. Um, it's going to my TP. I'm just going for the
[15:34] I'm not trying to go for, you know, nothing crazy. Just going for the high. And once it gets to the high, I'm getting out. So, let me fast forward this. All right. So, you see me out the market and I'm up uh 2,600 for that day.
[15:49] Okay. So, that's just me. Only look at the fiveminute chart. Only look at the fiveminute levels. And again, what is key is context. Okay. You have to understand that context. Once you understand the context, I believe your
[16:01] confidence will go up and I also believe that, you know, you can definitely see the market much clearer. Now, you're not going to be 100%. Nothing's never 100%. confidence and at least you can, you know, attack the market um much better
[16:15] and much clearer. So, that's pretty much it. Um, back test a lot. Work on your emotions, right? Study, study, study so you can get this down pat. And I hope you enjoy this. Until next time, you know what to do. Talk to you guys later.



⚡ Saved you 0h 16m reading this? Transcribe any YouTube video for free — no signup needed.