[00:02]
it to win more and lose less let's take a look so before we start looking at any live chart examples I want to break down the concept of inducement for you to show you why you need to be aware of it and how it can save you a lot of money
[00:14]
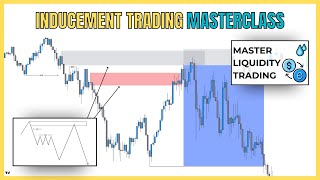
by understanding this concept and as well as saving you from losses it will trade so what you can see here on the chart is pretty much a explanation of now what we have here is a downtrend with two Supply zones now a lot of
[00:30]
people will look towards this Supply Zone here to actually sell the market when price comes into that area so we know at this Supply there's going to be a lot of sell orders waiting for us however this zone is very often what we
[00:42]
call an inducement Zone it's an area that attracts sellers before price takes out the level and moves higher into another Zone before moving in the right the screen many Traders will put this down as an
[00:58]
unlucky loss but it's not there's a lot of logic behind this setup and we can benefit us massively long term in our technical trading so how exactly do we work out whether a zone is a true zone or an inducement Zone well this comes
[01:12]
down to two big things first of all is liquidity second of all is imbalance so actually mark on here that there is an imbalance between this Supply and this
[01:24]
space which hasn't been filled in by price if the market had pulled all the way up and filled this imbalance then this for sure would be the right point to sell from but because we actually have price action a little bit like this
[01:37]
where the market didn't fill the imbalance what that actually does is leave some open space that the market is going to want to fill this is where the inducement comes in now inducements will be even more easy to spot when there is
[01:49]
liquidity so let's say there was a series of equal Highs at this level well that's going to lead us to understand that this is not a high probability area to trade from because price is likely going to take out these stops if we look
[02:02]
at inducement from a liquidity point of view liquidity is basically stop loss orders or stop orders in the market if we know the majority of people are going to be selling from this point we know the stop losses are going to be here so
[02:14]
price is going to reach for those stop losses to trade into the real point of reaction before the sell-off kicks in and those are the two key ways to spot going to take you over to the charts and show you two live examples so that you
[02:28]
in a real trading scenario hold up before we get into the real chart training that you can check out right now we go over a whole different bunch you from winning and show you how you can change your perspective to become a
[02:43]
winning Trader so check the link out in the description and join that there so here we have an example of inducement in a live trading scenario as you can see we have lower highs forming continually in this market and a breaker structure
[02:55]
which has just let us into a new downtrend now looking at this structure a lot of people will actually see this area here as a supply Zone to sell from Once price comes into it the problem is however there is imbalance above which
[03:09]
leads us into this Supply just here and this therefore acts as an inducement zone for the true Zone which is just above in this price point here and as you can see I've just marked on this small imbalance which leads through into
[03:23]
this large price area now another thing to note is that we have these almost which will act as a little form of liquidity leading us towards that point so what we would anticipate based on the inducement is not a reaction from this
[03:38]
Zone but instead a reaction from this one above and why is that well here we have a clear Supply so we know there are going to be a lot of sellers within this point with stops over the high here but we can also see that there is
[03:52]
equal High liquidity and an imbalance which leads us through to this point and absolutely no imbalance left so this is surely the right point to sell from okay we have this Supply here which has been retested by this candle we then have
[04:05]
this Supply here which has been retested by this candle and that formed this Supply which as you can see has not yet been retested so that is how we understand by using the imbalances in the market whether we are looking at the
[04:17]
true zone or not because obviously this could be an inducement Zone but if there was further imbalance up here potentially this could be as well so if price action our setup would look something like this we could look to
[04:29]
enter from the true Zone with a stop loss above and then Target down simply downtrend and we are likely to go and tackle that point and move into further tackle that point and move into further downside price action
[04:45]
market to play out that is exactly what happened now one final note before we close up the video you can actually get into inducement-based trades using confirmation entry approaches one did form on this setup it's not always going
[04:57]
risk you take when you go with confirmation entries but I'll show you how that would have worked here if you need that extra layer of confirmation to place on your trades so for this setup the initial reaction would have happened
[05:10]
at this point here but as you can see we then had this sell-off which was where the breaker structure started to come in and confirm the downside shift from the so what we could do is identify an area of Supply which in this case would be
[05:24]
this area here and then we could place our cell limits from there because what we now have is the inducement Zone taken out the real Zone retested and now a low time frame structure agrees with the high time frame picture that we had in
[05:38]
mind so the confirmation based approach would look something like this and yes it has lower risk reward than the initial risk entry but it's still a needs that extra layer of confirmation there is absolutely nothing wrong with
[05:51]
taking this version of the trade and that's it it's quite simple to actually understand identify and trade inducements when you are aware of them actually happening most people don't know that this happens so they write off
[06:03]
their losses as simple misfortunes when really a lot of Trades could actually be liquidity perspective and understood that actually this only we're selling from or buying from initially is an inducement zone so what I would advise
[06:16]
back test this you'll notice many different examples inducement happening on a daily basis across the pairs that you trade and by the way inducement frames as it does on the low time frames if you remember back to a couple of
[06:29]
weeks ago I made a video on a setup that me and my team took on eurogbp which was taken from a sweep of this liquidity the trade came through and filled into this area here before moving away and this in this instance was the inducement
[06:43]
Zone and this was the true Zone and that setup ended something a little like this watching and I'll see you in the next one
[06:57]
foreign [Music]