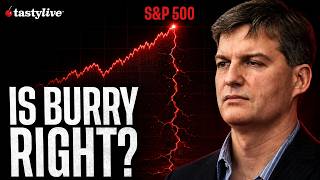

Michael Burry's Shocking Shorts Revealed
42sReveals a famous investor's controversial bets against top stocks, sparking curiosity and debate.
▶ Play Clip"The title promises an analysis of Burry's shorts and options pricing, which the video delivers, though with some market commentary filler."
This video analyzes Michael Burry's recent disclosure of seven short positions against major stocks and indices, examining what options markets are pricing in terms of risk and potential market moves. The host uses the tastytrade platform to dissect volatility, skew, and the likelihood of a significant sell-off.
Michael Burry disclosed seven shorts (semiconductors, Micron, Nvidia, Caterpillar, Palantir, Tesla, Applied Materials) on a day when the S&P 500 hit a record high, up 1.9%, and the Nasdaq gained 2.7%. He still warns of a 1987-style crash.
The VIX was elevated (up to 18.5) while the market traded higher, a historically unusual combination. Typically, calm climbs compress volatility, but recent sessions have seen massive upside moves that blew out the implied move in SPX (e.g., 50-point implied vs. 120-point actual).
ETFs like SMH and QQQ are heavily concentrated, with 5-10 companies controlling a massive portion of the funds. This concentration increases the risk of a macro sell-off in those products leading the market down.
Profit-taking and the human desire to protect gains can lead to selling, which adds downward pressure. If everyone sells, it compounds the downside risk.
In the near term, there is call skew (e.g., 7650 vs. 7850 strikes), indicating a short-squeeze feeling with many buying calls. However, longer-term, put skew dominates (e.g., 7500 strike has 6,500 premium vs. 5,500 for 8000), reflecting the market's persistent pricing of tail risk to the downside.
The market always prices in downside tail risk, as seen in put skew and premium. Upside moves like the last four days are rare but possible. The host notes that if red days compound, volatility could spike, and single-name stocks driving the move could lead to a massive downside move.
The video concludes that while the market is currently pricing in upside skew in the near term, the long-term risk of a significant sell-off remains, driven by concentration, human behavior, and persistent put skew. The host invites viewers to share their views on how to play NDX and SPX.
What seven short positions did Michael Burry disclose?
Semiconductors, Micron, Nvidia, Caterpillar, Palantir, Tesla, and Applied Materials.
00:15
What was the S&P 500's performance on the day of Burry's disclosure?
It closed at a record high, up 1.9%.
00:15
What is the historical significance of the year 1987 mentioned in the video?
The S&P dropped 20% in a single session.
00:29
What does the video say about the VIX and market movement in recent sessions?
The VIX was elevated while the market traded higher, which is historically unusual and not a sign of complacency.
01:12
What is the concentration risk in ETFs like SMH and QQQ?
Five to ten companies control a massive portion of those funds, increasing the risk of a macro sell-off.
02:34
What is the 'human element' that can lead to selling pressure?
The desire to capture gains or protect against losses, which can result in selling and add downward pressure.
03:02
What is the difference between near-term and long-term skew in SPX options?
Near-term shows call skew (short-squeeze feeling), while long-term shows put skew, reflecting persistent downside tail risk.
03:29
Burry's Shorts at Record High
Highlights the contrarian nature of Burry's bets against a market at record highs.
00:15Volatility-Market Divergence
Explains a rare market condition where rising volatility coincides with rising prices, signaling potential instability.
01:12ETF Concentration Risk
Reveals a structural risk in popular ETFs that many investors overlook.
02:34Call Skew in Near Term
Demonstrates how options pricing can indicate short-squeeze dynamics in the market.
03:29Persistent Downside Tail Risk
Shows that despite recent upside, the market consistently prices in the risk of a crash.
05:10[00:00] Michael Burry is short seven names. Six of them are working. The seventh is NVIDIA, the most valuable company in the world, or teetering between the most valuable company in the world and Apple, which overtook it recently.
[00:12] But by his own account, it's only losing money. It's the only one that's losing money. He disclosed that Tuesday, the same day the S&P 500 closed at a record for the first time since June, up 1.9%.
[00:24] The Nasdaq gained 2.7%, nearly 5% in two days. He short semiconductors, Micron, NVIDIA, Caterpillar, Palantir, Tesla, and applied materials into all of it. And he still says a 1987-type fall is possible, the year the S&P dropped 20% in a single session.
[00:41] So which is it? Is Burry, whose shorts are mostly profitable at a record high, simply early? Or is the one position losing money telling you more than the six that are winning? Let's take a look on today's edition of Options Math Check.
[00:56] So we are in the Tasty platform, and it's a really interesting question. I mean, the risk of a big sell-off from here is always apparent. I think one of the more nuanced situations that we've had in the markets recently was the last couple of days,
[01:12] if you look at the VIX and you overlay the VIX gains on the S&P, like yesterday the VIX was up all day and it was elevated. Today, you saw it rally.
[01:24] And what was interesting, you saw the VIX up at like 18.5. It's now at 16.25. But the market has not moved to the downside. The E-minis haven't moved to the downside in any kind of substantial way. You can see every single day over the last four sessions, we've been trading higher.
[01:39] But historically speaking vol up and market up big isn necessarily a situation for a market calm or market complacency Generally speaking when you see the E up over time and you see a calm climb higher
[01:54] that's when you can really see volatility compress because the intraday ranges are compressed as well. But the last four sessions, we've seen massive moves to the upside, and we've been blowing out the implied move in SPX every single day.
[02:07] Like we look at SPX in the morning, there's a 50-point implied move, and we have a 120-point realized move. And that's been the case for the last couple of days. So interesting to see the markets calming down right now, volatility collapsing a little bit.
[02:20] But when you have these mega companies that control so much capital in the space, you'll always have the risk of a macro sell-off in those products leading the way to the downside. I think when you look under the hood at ETFs like SMH and QQQ,
[02:35] you might be surprised to see that five to ten companies really control a massive portion of those funds. So to Burry's point, yes, we could see a big washout in the market,
[02:48] especially after a rip higher that we've seen in the NASDAQ and the E-minis. Some people say this was the result of a capital unwind, a leverage unwind, which is certainly part of it.
[03:01] but when you look under the hood and you see profit taking and you think about the human element I think this is something that is always going to be the case the human element of seeing losses or seeing gains go away you want to capture that you want to protect yourself and that can
[03:17] result in selling and if everyone's selling that just adds more pressure to the downside so I think the risk is always going to be there the market always pricing in risk to the downside If you look at SPX or you look at the NASDAQ over like any sort of time frame here you look at SPX 15 days out we trading at 77
[03:37] If we go to 76.50 and we go to the equidistant out-of-the-money upside strike, the 78.50, what you'll see is plenty of skew here.
[03:50] And what's really interesting is when you look at the near-term versus the long-term, 76.50 versus 78.50, you're actually seeing call skew here, which is what we talked about this morning.
[04:02] Something rare that you don't see all the time is this baked-in skew to the upside, which is kind of this short squeeze feeling we've seen to the upside with so many people buying calls.
[04:14] and a lot of that could be a result of over short selling or selling too many shorts relative to notional but at the end of the day if you go further out in time you'll start to see that
[04:26] shift closer to put skew especially as you go further out of the money so if we go to like the 8,000 strike in the September cycle trading for 5,600 bucks about 250 points out of the money
[04:38] and then you go to the 7,500 level, you start to see that puts you come into fruition here. 6,500 premium on the downside relative to 5,500 on the upside.
[04:52] So in the S&P 500, you're always going to see, especially in the long term, you'll see kind of an escalator up in terms of risk and an elevator down. And that will be the case into perpetuity unless you have these crazy, very unique events
[05:07] where maybe you get some near term calls for you in markets like SPX. But when you look at probabilities and you think about few especially the further on time you go you have lower probabilities that you have a thousand point move to the upside versus the downside And you see the
[05:22] put skew and the put premium kind of hold on to its value a lot more. So the markets are pricing this in. The markets always will price in that tail risk to the downside. You rarely see moves
[05:34] to the upside like we saw over the last four days, but that doesn't mean that they can't happen again. But right now, E-minis and NASDAQ sliding. E-minis were up 50 and the NASDAQ was up 150 just this morning. And now we're a couple of hours into the morning session and the E-minis are flat and
[05:50] the NASDAQ is down 60. So we're seeing the interesting movements under the hood, but this can kind of compound onto itself. If you start to see more days where we get red days, red days, red days, 100 points in the E-minis up to the downside. If that happens a couple of times,
[06:05] you'll see this whole thing shift. You'll see a lot more puts to be infused into the market. You'll see volatility spike up. And again, if you have these single name stocks that are driving this move to the downside
[06:17] and these single name stocks are selling off aggressively, that is one of those catalysts that could result in a massive move to the downside in the S&Ps and NASDAQ. But let me know what you think in the YouTube chat,
[06:30] in the comments. Of course, we always appreciate your contribution and your activity there. So let us know what you think with this move in the markets. Let me know how you're playing, NDX, SPX,
[06:43] and whether you think the short is still alive and well. But, yeah, this has been a fun episode of Options Math Check. We'll keep doing these and posting them to the YouTube channel. So we'll see you next time.


⚡ Saved you 0h 07m reading this? Transcribe any YouTube video for free — no signup needed.