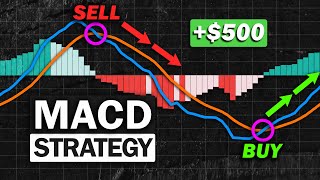

How MACD Really Works (4 Components Explained)
60sClear, visual breakdown of a popular indicator that many traders misuse, offering immediate educational value.
▶ Play Clip"Delivers on the promise of effective MACD strategies, though the 'most effective' claim is subjective and the advanced strategy is a common approach."
This video explains the Moving Average Convergence Divergence (MACD) indicator and presents two trading strategies: a beginner-friendly approach combining MACD with a 100 EMA, and an advanced method that integrates MACD with price action and lower time frame confirmations. The presenter demonstrates how to apply these strategies to crypto, forex, and stock markets.
MACD is a trend-following indicator showing the relationship between two moving averages. It has four components: MACD line, signal line, histogram, and zero line.
The MACD line is faster and more sensitive to price changes; the signal line is slower. The histogram represents the difference between the two lines, turning green when MACD crosses above signal and red when it crosses below. The zero line is the center.
Traders identify momentum by looking at crossovers: MACD crossing above signal indicates upward momentum, crossing below indicates downward momentum. Histogram size indicates momentum strength.
MACD is based on moving averages (default 12 and 26). Compared to simple moving averages, MACD provides earlier entry signals because it uses the signal line crossover, not the zero line.
Using MACD alone can give false signals in a downtrend because it only shows short-term momentum. Traders should consider the long-term trend to avoid trading against it.
Combine MACD with a 100 EMA to align with the long-term trend. If price is above 100 EMA, trend is up; take only bullish MACD crossovers. Place stop loss at nearest swing low and profit target at 1.5x stop loss.
For advanced traders, combine MACD with price action. Identify key levels on a higher time frame, wait for price to approach the level, then zoom in two time frames below to confirm momentum with MACD crossover before entering.
Demonstrates the advanced strategy on GBP pairs: identify support level, wait for price to return, zoom in two time frames below, wait for MACD bullish crossover, enter long, set stop loss at key level and profit target at 1.5x stop loss.
The video provides two practical MACD strategies: a simple one for beginners using a 100 EMA filter, and an advanced one for experienced traders using price action and lower time frame confirmation. Both aim to improve win rates by aligning with the trend and avoiding false signals.
What are the four components of the MACD indicator?
MACD line, signal line, histogram, and zero line.
00:41
What does the histogram represent in MACD?
The difference between the MACD line and the signal line.
01:08
How do traders use MACD crossovers to identify momentum?
If the MACD line crosses above the signal line, it indicates upward momentum; if it crosses below, it indicates downward momentum.
01:47
Why is MACD preferred over simple moving averages?
MACD provides earlier entry signals because it uses the crossover between the MACD line and the signal line, not the zero line.
03:12
What is a common mistake when using MACD alone?
Using MACD alone can give false signals in a downtrend because it only shows short-term momentum, and traders may trade against the long-term trend.
03:38
In the beginner strategy, what is the role of the 100 EMA?
It identifies the long-term trend: if price is above the 100 EMA, the trend is up; if below, the trend is down.
04:30
What is the recommended profit target in the beginner strategy?
Set the profit target at 1.5 times the stop loss distance.
05:14
In the advanced strategy, how do you confirm momentum at a key level?
Zoom in two time frames below and wait for a MACD crossover in that smaller time frame.
07:47
Combining MACD with 100 EMA
This simple filter helps avoid trading against the long-term trend, significantly improving win rates for beginners.
04:17Advanced MACD + Price Action
Using lower time frame confirmation at key levels provides earlier and more precise entry signals than relying on the higher time frame crossover alone.
06:10MACD's Early Entry Advantage
MACD gives earlier signals than moving averages because it uses the signal line crossover, which is a key insight for momentum traders.
03:12[00:02] strategy that you can use with the macd indicator so without further ado let's get on with the video the moving average convergence divergence or also known as the macd
[00:15] is one of the most simplest and popular indicator used by traders essentially it is a trend following indicator that shows the relationship between two moving averages so first let's apply it onto our chart
[00:29] section type in macd and click the one on top now before we start we first need to know how does the macd work
[00:41] so we can see here there are four components to the macd first we have these two lines the macd line and the signal line notice the difference between the two the macd line moves faster and is more
[00:54] sensitive to price changes which will be the main focus of the macd compare that to the signal line which reacts slower to price changes appearance next we have the histogram which
[01:08] represents the difference between the macd line and the signal line for example if the line crosses above the signal line the histogram will turn green and if it crosses below
[01:20] the histogram will turn red the gap between the macd line and the signal also affects the size of the histogram as you can see if the two lines are further apart the histogram gets bigger
[01:33] and if the two lines get closer the histogram becomes smaller and finally we have the zero line which simply represents the center of the macd now the way traders utilize this indicator to identify momentum
[01:47] is by looking at the crossover between the macd line and the signal line the macd line and the signal line let me show you an example if the macd line crosses above the signal line it indicates that the market is on an
[01:59] and if it crosses below it indicates that the market is only downwards momentum traders can also utilize the size of the histogram to determine the strength of the momentum itself
[02:12] line while the histogram is getting it shows us that the upwards momentum is getting stronger smaller in size it indicates that the upwards momentum
[02:25] it indicates that the upwards momentum is getting weaker macd is based on moving averages and so the question is why should you and not the moving average well let me give you a quick comparison
[02:41] default settings 12 and 26 and over here we also have two which are set to the same values as the macd which are 12 and 26. notice the correlation between the two
[02:57] indicators every time we have a crossover on the moving averages we also have a crossover on the macd but it's between the macd line and the zero but remember what we look for in the macd is not the zero line
[03:12] but rather the crossover between the macd line and the signal line the macd gave a much earlier entry signal average that's why i prefer it as my momentum
[03:26] that's why i prefer it as my momentum indicator strategies that you can use with the macd indicator so first a common mistake that traders make is that they're using the indicator
[03:38] let me show you why it's a bad idea to use the macd alone so here we can see that the overall market is only downtrend upwards so notice how the signals are
[03:53] bullish momentum but the market is only downtrend this is by itself because what the macd is showing us is
[04:05] only the short term momentum and as traders we also need to take the long term trend into consideration because we never want to trade against a trend and so a simple but high win rate strategy that
[04:17] i recommend for beginners is by combining the macd with a long term trend indicator like the 100 ema this way we can safely trade the macd while making sure that we're staying within the same direction
[04:30] of the long-term trend so this is how you trade the strategy the long-term trend by looking at the 100 ema if the price is above the 100 ema it indicates that the long term trend is up
[04:47] and if the price is below the 100 ema it indicates that the long term trend is down so once you've identified the trend the crossovers on the macd that shows the same signal as the long
[05:00] so in this particular example we can see is up meaning we only take signals when the macd crosses over upwards and so here's where you want to take a long position now for your exit strategy
[05:14] nearest swing low and set your profit target at 1.5 times your stop loss and as you can see this trade ended up being profitable so let's look at another example
[05:29] in this chart we can see that the price is below the 100 ema indicating that the long term trend is down next we have a cross down on the macd and so this will be our entry signal to go
[05:42] now for your stop loss place it above the nearest swing high and set your profit target at 1.5 times your stop loss and as you can see the price hits our profit target and so this counts as a
[05:56] successful trade so that was a simple macd strategy for beginners that you can use now for advanced traders if you want to get more profits using the macd you cannot simply rely on beginner
[06:10] because remember crossovers tend to work only on trending markets the indicator will give you many false so that is why if you want to increase the win rate i recommend using a more
[06:25] advanced version of the strategy which is by combining the macd with price action so here's how the strategy works the first step is we need to choose a time frame
[06:38] time frame now the next thing you need to do is identify a key level within this time frame so as you can see the price went up hit and reverses downwards and so we can
[06:51] draw a resistance line up here the next step is you want to wait for the price to approach the same key level once again now once this happens we are expecting the price to reverse downwards
[07:03] key level doesn't guarantee that a reversal will happen because key levels aren't magic prices can and that is why we need to use extra confirmation to make sure that there is
[07:18] actual downwards momentum as price touches this area which is play now what most traders will do is that cross over downwards before taking a short position
[07:32] by doing this notice that the downwards movement has already been made movement has already been made and you would have entered in late an earlier entry signal is by zooming in two time frames below
[07:47] so i'm currently in the four hour chart so let's zoom in into the two hour chart need to do is wait for the macd to cross over downwards in this new smaller time frame and so this is where you want to take a
[08:01] short position so now let's go back to the 4 hour chart and compare the two entry signals so now we're back at the 4 hour time if you would have used the crossover from the two hour time frame
[08:15] you would have entered in the trade here but if you would have used the crossover from the four hour time frame you would have entered in here and even profitable the smaller time frame crossover still
[08:28] so let's look at the strategy one more so here's the poundian on the two hour time frame and over to the left reverses upwards making this a key support level now as
[08:43] prices went back to this level again we want to confirm that there's actual upwards momentum as price touches this area so again you price touches this area so again you want to zoom in two time frames below
[08:55] and apply the macd indicator so now all we need to do is use the macd to confirm the bullish momentum by waiting for it to cross over upwards once this happens you take a long position now let's go
[09:09] back to the two hour time frame and apply our exit strategy so for our you can place it at the key level and set your profit target at 1.5 times your stop loss and as you can see this trade
[09:24] ended up being profitable so i just revealed to you high win rate use right now and all i ask for in return is for you to invest two seconds of your time into liking the video and subscribe to the
[09:38] it literally takes only two clicks but it means so much to me videos as well so thank you guys for watching and i'll see you in the next watching and i'll see you in the next video




⚡ Saved you 0h 09m reading this? Transcribe any YouTube video for free — no signup needed.