
How I Turned $1,300 into $17K in 2 Months
60sHigh-earning claim with a specific dollar amount and time frame creates curiosity and desire for the strategy.
▶ Play Clip"Delivers on the promise of revealing a profitable moving average and provides actionable setups, though it includes promotional segments."
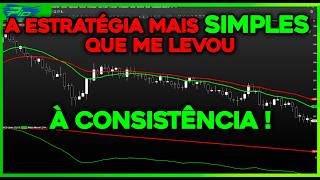
The video revisits the 'Harbor' trading strategy that earned the creator R$17,000–19,000 in two months using mini-dollar futures, focusing on the 'Mesa' moving average indicator. It explains how to use this indicator in its classic form and demonstrates two adapted setups for the Brazilian market, including a backtested strategy with an 80.7% success rate.
The creator recalls the Harbor strategy, which used the classic Pilsar method with parabolic SAR, and earned R$17,000–19,000 in two months trading mini-dollar futures with an initial R$1,300.
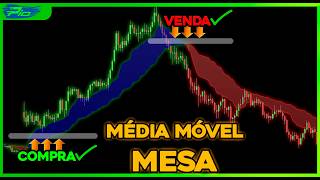
The strategy's secret was the 'Mesa' moving average, which was only available on the Trad platform, not in Profit Chart. The creator developed it for Profit Chart and now offers it as a free bonus.
Classically, the Mesa moving average is paired with a confirmation average called FAMA. Mesa is the fast line, FAMA is the slow line. Crossovers indicate trend direction: fast above slow = uptrend, fast below slow = downtrend.
The Mesa moving average behaves like a staircase, providing dynamic support and resistance levels. The creator used it as an entry point when price retraced to it, with Pilsar signals for direction.
A classic day trading setup for mini-dollar futures: use Mesa and FAMA averages, RSI with 50 line, and ADX with 25 line. Wait for crossover, confirm RSI direction and ADX strength, then enter at market on next candle open with 0.15% stop and target.
A possible setup using Mesa/FAMA, slow stochastic (100 periods) with 75/25 lines, and Renko charts (10-period) starting from 9:20. Buy when stochastic crosses above 75 and averages are blue; sell when below 25 and averages are red. Uses 300-point stop, 150-point target.
Backtest from April 1-23, 2026: 1050 points, 21 wins, 7 stops, 75% success rate. The creator notes this is a possible setup, not a ready-made one.
Another possible setup using Mesa/FAMA, Donchian channel (144 periods, shift 1), and Aroon oscillator (100 periods) with -70/70 lines. Buy when price touches upper Donchian with Aroon above 70 and averages blue; sell when touches lower with Aroon below -70 and averages red.
Backtest for April: 1650 points, 21 wins, 5 stops, 80.7% success rate. Again, the creator emphasizes this is a possible setup requiring further testing.
The Mesa moving average is a free bonus for joining the Telegram group 'VIP Pilsar 3.0'. Download the file, open Profit Chart, go to Strategies > Import/Export, import the file, then find it under Indicators > More Indicators > 'Mesa moving average Pilsar trader'.
The Mesa moving average, once a secret to the Harbor strategy's success, is now available for Profit Chart and can be adapted into various setups. The creator encourages traders to test these possible setups and find what fits their profile, emphasizing that backtesting is essential.
Profit Chart
tool
Trad platform
tool
Mesa moving average indicator
tool
FAMA moving average indicator
tool
Pilsar indicator
tool
RSI indicator
tool
ADX indicator
tool
Slow stochastic oscillator
tool
Donchian channel
tool
Aroon oscillator
tool
Telegram group VIP Pilsar 3.0
service
PILS 3.0 method
service
What is the 'Mesa' moving average?
A moving average indicator that was originally only available on the Trad platform, now developed for Profit Chart. It behaves like a staircase, providing dynamic support and resistance.
00:33
What is the FAMA moving average?
The confirmation average that accompanies the Mesa moving average. Mesa is the fast line, FAMA is the slow line.
01:49
How do you interpret crossovers of Mesa and FAMA?
Fast moving average (Mesa) above slow (FAMA) indicates an uptrend; fast below slow indicates a downtrend. The averages turn blue on upward crossovers and red on downward crossovers.
02:43
What is the classic crossover setup for mini-dollar futures?
Use Mesa and FAMA averages, RSI with a horizontal line at 50, and ADX with a horizontal line at 25. Wait for a crossover, confirm RSI direction and ADX strength, then enter at market on next candle open with 0.15% stop and target.
06:32
What is the role of the RSI in the classic setup?
RSI confirms the direction: above 50 indicates an uptrend, below 50 indicates a downtrend.
09:37
What is the role of the ADX in the classic setup?
ADX shows the strength of the movement, not direction. Above 25 indicates strength, below 25 indicates weakness.
10:07
What are the parameters for the first adapted setup?
Renko charts (10-period), slow stochastic (100 periods) with horizontal lines at 75 and 25, and Mesa/FAMA averages. Start from 9:20. Use 300-point stop loss and 150-point target.
14:32
What is the success rate of the first adapted setup in April backtest?
75% success rate with 1050 points, 21 wins, and 7 stops.
20:55
What are the parameters for the second adapted setup?
Donchian channel (144 periods, shift 1) and Aroon oscillator (100 periods) with horizontal lines at -70 and 70. Use Mesa/FAMA averages. Use 300-point stop loss and 150-point target.
21:40
What is the success rate of the second adapted setup in April backtest?
80.7% success rate with 1650 points, 21 wins, and 5 stops.
28:38
How do you install the Mesa moving average in Profit Chart?
Download the file from the Telegram group, open Profit Chart, go to Strategies > Import/Export, import the file, then find it under Indicators > More Indicators > 'Mesa moving average Pilsar trader'.
29:19
Harbor Strategy Success
Demonstrates a real trading strategy that yielded significant returns, providing credibility to the indicator.
00:01Staircase Behavior
The unique behavior of the Mesa moving average as dynamic support/resistance is a key insight for traders.
03:10Classic Crossover Setup
Provides a concrete, testable trading setup with specific indicators and parameters.
06:32Backtest Results
Quantitative results (75% success rate) give evidence for the strategy's potential.
20:55High Success Rate
80.7% success rate in backtest is impressive and highlights the potential of the second setup.
28:38[00:01] least 2021, you probably remember this Harbor strategy. It was one of the most successful strategies at the time because it marked the first challenge I faced in day trading. I took R$1,300 trading mini-dollar futures and in
[00:17] 2 months I reached between R$17,000 and R$ 19,000, operating only with this strategy. In the Harbor range, we use the Classic Pilsar method with the parabolic indicator. But beyond that, this strategy had a secret, a
[00:33] moving average that almost nobody knew about, [music] the moving average table. Never heard of it? That's normal; almost nobody knows about it because this moving average doesn't exist in Profit Chart, it only exists on the Trad platform. And because of that, over
[00:48] time, I ended up neglecting her. But I never forgot about that moving average. I've never forgotten the excellent buy and sell entry points she generated for us in the mini-dollar market. And that's why, man, I
[01:04] even better, because I took the table moving average and developed it for Profit Sharp. That's right, man. As I said, it only existed in Tradium, but now you can use it in Profit Chart as well. And in today's lesson I'm going to
[01:18] show you two things. First, how does the moving average table work in its classic form? And secondly, how I adapted this moving average to my trading strategy. And pay close attention, because the moving average table can be the turning point
[01:32] you're looking for in your strategy, in your trading. strategy, in your trading. So come with me, man.
[01:49] Dude, when I decided to study the Mesa moving average more in depth, I ended up discovering that, classically, it 's always accompanied by a confirmation average called FAMA. So, look , the average table is the fast line and the
[02:03] average fame is the slow line. It's the same old story: a fast moving average above a slow moving average equals an upward trend, and a fast moving average below a slow moving average equals a downward trend. So here we have the table moving average and the fame moving average
[02:17] . If you click on this indicator, you'll see that you'll have here, look, show table and show fame. If you only want to use the medium table, just select it here, look, not for fame but for the table. Look
[02:31] , only the table moving average will remain on the chart and vice versa, right? If you only want to use the average fame, you set the table as no. And fame, you put that as a yes. And then you only use the average fame. But for now, let's
[02:43] put these two moving averages here . And they became quite intuitive, did n't they? So, when the averages are crossed upwards, they turn blue. When these averages cross downwards, they turn here, look, in
[02:55] red. So, the reading here is very simple, they are red, okay? showing a downward trend. They turned blue, indicating an downward trend. And so on, man. Blue indicates an upward trend, red indicates a
[03:10] downward trend, and so on. Now, what attracted me to the moving average table wasn't the crossovers, mainly because I wasn't even familiar with the moving average fame; I only knew about the moving average table. In trading, there was only a moving average table.
[03:24] What attracted me to this moving average was its behavior in establishing support and resistance levels. Because regular moving averages , they behave more like this, right? Softer. But the table moving average, no, the table moving average
[03:37] behaves more like this, look, as if it were a staircase. And I was able to see that she generated several good sales signals during those moments when she, look, lay more horizontally. So here, for example, the average table offered
[03:50] good resistance. Here too, look. So, observing this, I was able to understand that if my strategy generated, for example, a sell signal, I could use the moving average table as a good entry point. In this
[04:04] selling, you could use the moving average table as a resistance area. That's what attracted me to the moving average table, those resistances that the strategy gave a sell entry signal and the price retraced to the moving average
[04:20] , I would execute the sell order, believing that the price would fall again. It gave another sell signal and the price retraced to the moving average, I sold again and I did this until I hit my target. And of course, when my strategy
[04:32] started generating buy signals and entries , right, when it started identifying a strong upward trend, I would then use the moving average table as a support region, because you see, the moving average table becomes more horizontal, making it
[04:44] place the buy order, giving me greater confidence in my strategy. So, if my strategy gave a buy signal, I would then use the moving average table as support. Look, I kept buying things here
[04:57] until I hit my goal, you know? That same story, but in a sales setting, right? Wow, the strategy gave a buy signal. When it retraces to the moving average, I go back up. It retraced to the moving average , so I bought again, believing
[05:10] did that until I reached my goal. So, that's what attracted me to the moving average table, the entry points, the dynamic supports and resistances. I have never used the moving average table to find the trend. I only used
[05:25] that moving average to buy or sell. And I used the classic Pilsar method , that is, my method with the parabolic SAR, to know when to buy sure, I would use my Pisar indicator with the moving average table,
[05:40] or I would just use my Pisar coloring as well, look. And then maybe I could operate only with the average table and my piçar coloring. Oh no, the color turned red along with the moving average, which also turned red.
[05:53] look, when the price retraces to the moving average, right? And then I wouldn't sell anymore, I would wait for the price to turn green with the candles and blue with the moving average. And then when the price retraced, I would buy at the moving average
[06:06] , believing that the price would start to rise again. To perform another to turn red again, along with the red moving average. Then I would sell again when the price retraced to the moving average
[06:18] , you understand? So, nowadays I would n't use the two parabolic s that I moving average table. I would probably only put the coloring and moving average table in place for trading. But continuing, classically these
[06:32] moving averages are used as entry triggers in crossovers. Unfortunately, all these setups that I've studied usually don't work very well here in the Brazilian market. But anyway, take a look at this classic
[06:46] day trading setup called a crossover with a filter. This classic setup works best with the mini-dollar futures. So let's change it here, look at W foot. And it's for the 2-minute timeframe. Then type the number two and press the enter key.
[07:00] minute timeframe on the timeline. Let's now configure this classic setup. We come up with research here, look, by table. It's going to show up here, look. We click to insert into the chart. Here is the table moving average along with the fame moving average.
[07:15] And now we go to indicators and we put in the RSI indicator. We also we put in the RSI indicator. We also included the ADX indicator. The RSI indicator needs to have a horizontal line at the 50 level, okay? And the ADX indicator
[07:29] needs to have a horizontal line at the 25 level. The ADX is indeed a nine-period indicator . Now the RSI (Relative Strength Index) for the 14-period period. That's it, this is the classic setup that uses the moving average and works best here in the
[07:42] Brazilian market. Let's use as an example the trading session that begins with this candle right here. Look, just take a look. The averages are crossed upwards, which is why they are shown in blue. The first step in this classic process is to wait for the moving
[07:54] averages to cross. Notice that the averages have now crossed downwards, which is why they've turned red, right? Then they crossed down. After a downward crossover occurs, we need to observe the IFR and the ADX. The RSI
[08:08] needs to be below the 50 level here. And the ADX needs to be above the 25 level. So, I repeat, if the averages cross downwards, as they did here, we need to observe the RSI. The RSI needs to go below the
[08:24] 50 level, as it already is, and the ADX needs to go above the 25 level. When these three criteria are met—that is, the averages have crossed downwards, the RSI is below 50, and the ADX is above 25—we then wait for the candle to close, and
[08:41] at the opening of the next candle, we sell at market. [clearing throat] click sell market. The sell order would be placed here, and look at the stop loss for this trade, according to this classic setup, it's 0.15%
[08:56] of the upward price variation. Notice that the variation at that point where I have variation at that point where I have the mouse cursor is 0.15%. That's where stop. And the exit from the trade, Pio. Dude, the exit from the trade
[09:09] trade, Pio. Dude, the exit from the trade is at a variation of -0.15% would be down here. Of course, you'd need to do all this very quickly, but this is the classic setup, OK? So, in this case, we would have a
[09:24] stop loss of eight points and a target of eight points as well. So, our buy order would be initiated in this region, and down here, look, the price would already be right to exit the trade. This is how we operate this classic setup in a
[09:37] sales scenario. So, just to be clear, the IFR in this setup is used to confirm the direction. If the RSI is above the 50 level, it indicates an upward trend. If it's below the 50 level,
[09:53] it's showing a tendency towards cycling. This is how we read the RSI in this setup. Now, on the other hand, the ADX doesn't show us the direction of the price. The ADX shows us the strength of the price movement. So, if the ADX
[10:07] is above 25, it means we have strength in the movement, whether it's downward or upward. Now, if the ADX is below the 25 level, it means move, understand? So the ADX serves to give us strength, and the RSI serves to
[10:23] confirm the price direction in this setup. But of course, the driving force behind all of this is the crossover of the averages, the crossover of the average table downwards from the average fame. So we had a gain in that first example. Let's look at an example of a
[10:37] right? There was this crossover of averages here. You wait for a new crossover, you notice that the averages are red for now, but look, up here the averages have crossed upwards, so much so that the averages have turned
[10:50] blue. So now we are in a buying scenario. And this classic setup says the following: "Okay, the averages crossed upwards, so take a look at the RSI. RSI is above 50, OK? So we've already met the second
[11:04] criterion. The first criterion is the upward crossover. The ADX is showing strength, that is, it's above 25. Yes. So, the third criterion has also been met. What do we do then? We wait for this
[11:16] candle to close and when this candle closes we buy at the opening of the next market. We would come here, look, we would buy at market, according to this would be opened in this region here, then, right? And that story, our target
[11:31] would be the variation, right, of 0.15%. So you would drag here with the mouse, look, 0.15% up here. So here is the exit of your operation, the target, look, I placed a sell order there. And the stop would be a variation of -0.15%
[11:46] downwards. [snoring] I'm going over with you exactly how this classic setup works. It wasn't a setup I created; it's a setup developed for the American market. Of all the classic setups I've tested, this one
[11:59] worked best for the mini-dollar. So, in this case, we would have a stop here, look, this size, and a target of the same size upwards. Our buy order would be would exit the trade up here. So, this is the crossover setup with a
[12:14] filter in a buy scenario; this is how it works, okay? When there's an upward crossover, as was the case here, look, it crossed upwards, you'll observe the indicators. Notice that the ADX alone is already canceling
[12:27] any kind of buy here because the ADX is below 25, showing us that the market is weak, so we wouldn't buy here, you understand? So, all the indicators here need to be in accordance with the setup
[12:40] for you to execute the trade, of course. So, one last example here. Wow, here the averages crossed downwards, but look... Okay, so the ADX is below 25, so we wouldn't sell here. Then, further ahead, look, the moving
[12:52] averages crossed upwards. Everything's fine, RSI above 50, DX above 25. You would then buy at the opening of this candle right here with a stop loss of -0.15%, look, so your stop loss would be
[13:07] 0.15% upwards. Look here, this is where your target would be. You see, it would be another great buy operation here. To let's look at a sell signal. Let's see if we had a sell signal here.
[13:21] Look, here the moving averages crossed downwards, right here on this candle. RSI below 50. Okay? So, we already know that the RSI is confirming the ADX is above 25, in the price movement. So, we
[13:35] next candle opens, we already... Come here, look, click on sell market. We would sell more or less in this region. The stop would be at 0.15%, right? The variation there, look, the stop would be up there and the target would be -0.15%, it would be
[13:52] risk-reward ratio of one to one. And that's it , we would wait, right, for the price to either hit the stop or hit the target, right, in that case, the price would trigger our sell order in this region, right, and down here we would already be able to exit the
[14:06] operation. So this was the classic setup with the most interesting moving average that I managed to extract from the American market. If you are a classic trader, right, if you liked this setup, test it a lot to
[14:18] confirm that this classic setup works here in Brazil as well, because several setups from the American market don't work here. How to use the get away from the conventional. I'm going to
[14:32] show you some ideas and some setups that we could develop with this thing I would do is the following. I would double-click on the moving average. I I would put fill, fill with color, and click OK. That way,
[14:46] man, the visualization already looks nicer, right? Another thing I would do is go to the mini-index. So, I would go, look, to info. Then, I would type 10 R to go to the 10-period chart. If the periods here
[14:59] were like this, look, without wicks, I would then change it to candlestick. It would look like this . And in this first possible would go to indicators and go to slow stochastic, with a
[15:15] horizontal line at the 75 level and a horizontal line at the 25 level. We put here, look, 100 periods. We double-click on the moving average and we go to appearance, we'll put the color black with a dashed line. That
[15:29] way, we hide the moving average. In the stochastic oscillator. We only observe the white line, okay? That way it's easier for us not to get confused. And the idea I would bring to this possible setup would probably be the following
[15:41] . I would always start from 9:20, because Renco tends to be very So I would only start from 9:20. 920. From this region here, I would observe the stochastic oscillator. I would wait for the stochastic oscillator to go above this
[15:57] horizontal line of 75, which I will even change the color to green. Then I would wait for horizontal line or below the horizontal line at the 25 level, which I will change the color to red. I would wait for the stochastic oscillator to go above the
[16:12] red horizontal line. I waited and waited and look, the stochastic oscillator crossed above the green line. And then I would observe the Mesa moving average and the Fama moving average, right? If they were blue like this , I would already position my
[16:27] buy order right here, look, at Average table. I would use that famous risk-reward ratio I like to use, 300-point stop loss, 150-point target, okay? Negative risk-reward. That's how I like to operate.
[16:39] triggering my buy order right here, having the support of the moving averages that were here in blue and also having the support of the stochastic oscillator, which is above 75. The stochastic oscillator in this configuration shows me the direction of the price,
[16:53] the green horizontal line, I will consider it an upward trend. If the stochastic oscillator is below the red line, I will consider it a I showed you, the stochastic oscillator was above the green horizontal line and the moving
[17:08] I positioned my buy order in the region of the moving averages, believing that they could provide support for us . That's the logic of this possible setup. From the moment the price falls and triggers my
[17:23] wait for the price to fall to stop out, and in that case, I would lose 300 points. Or I wait for the price to rise to hit my target, and in that case, I would make 150 points, you understand? In this example, the price rose and
[17:38] hit my target. So here we would have the first gain of the day. So we would have a first gain of the day in this possible setup, right, that we are developing here. And now, to have another signal, I would need to
[17:51] wait for the stochastic oscillator to return and be between these two horizontal lines again. That is, I need the stochastic oscillator to come back in here. Look, it has to be between the green line and the red line right here. So
[18:04] Look. So I wait for that to happen. Look, the stochastic oscillator has returned, as you can see, it is again between the two lines, between the green line and the red line. And now, yes, I can repeat the step-by-step process. I
[18:18] stochastic oscillator either goes above the green horizontal line or below the red horizontal line. And you happen. You wait, wait, wait, wait. And
[18:31] now, look , the stochastic oscillator went above the green horizontal line. And when that happens, I quickly check if the moving averages are blue or red. Notice that they
[18:44] are blue. And that allows me to believe again that these moving averages might be providing support. So the buy order would be triggered later. Here, look, we would follow the
[18:56] moving average. Our buy order is selected here, and the price would take off up here, exiting the trade. That would be the second gain of the day, right? We would make another 150 points, totaling 300 points, since we also
[19:08] had 150 points in this first trade. According to my trading here. Strategy: I would use a positive target area of area of one stop-loss. If I have two consecutive gains, I stop trading. And if
[19:23] I have a stop-loss, I would also stop trading. Of course, you don't need to . I'm just sharing an idea of a possible setup with this indicator, using the Mesa moving average and the Fama moving average. Okay? Let's take a look at
[19:37] the previous trading session to see if this strategy would have worked or not. Always starting from 9:20, as I told you. 9:20 is from here, right? Look, we're in a trading session prior to the one I just showed, so we
[19:49] wait for the stochastic oscillator to go above the green line or below the red line. In this case, it went above the green line. The moving averages were blue, so I would buy here, look, my buy order would be triggered
[20:01] catch up, I would exit the trade, and I would have my first gain of the day. After that, I wait for the... The stochastic oscillator returned to its normal position between the lines, right, between the green line and the red line. And now I would wait for the stochastic oscillator to go
[20:15] above the green horizontal line or below the red horizontal line. I things to happen. What happened was that the stochastic oscillator went below the red horizontal line, and seeing the moving average and the FAMA moving average
[20:28] in red, I would then place my sell order right here. Take a moving average until my order was triggered. This, of course, if the stochastic oscillator continued to provide the conditions, my sell order would be executed
[20:41] region, the price would already be exiting the trade, it would be the second profit of the day. risk management, I would have already hit my daily positive target here. I'm going to run backtests of this strategy now in April to see how
[20:55] I'll be back here with the results for you. Well, I finished the backtests for the day. From April 1st to April 23rd, 2026, in this possible setup of ours. And the result this month is 1050
[21:10] points, seven stops, 21 wins, and the success rate this month is 75%. risk management; it doesn't mean you need to operate this way too. And remember, this is a possible setup, not a ready-made setup.
[21:26] I would need to do the backtests I've done here in several other months to know if it's a concrete setup or not. So if you found this setup interesting, test it and draw your own conclusions. Look, another
[21:40] possible setup that is more promising than the one I just showed is the following. We are here with the moving average accompanied by the Fama moving average. Let's insert a Doncha channel. Let's also insert the Arum
[21:52] oscillator indicator. What do we do? Double-click here, look, on the Doncha channel, remove the central moving average, put 144 periods with a shift of one. Now we click on the Arum. Oscillator, put it here, look, at 100 periods. This
[22:04] than the other. We also put a horizontal line at -70 and another horizontal line at the 70 level. " Hey, Pi, but I work, I study, I don't have time to keep up with and update the strategies, and I don't
[22:18] have time to develop good strategies," man, don't worry. If simply can't develop good strategies, in the description of this video I left the link to the PILS 3.0 method, and there you will find the same
[22:32] strategies and robots that I use in my day-to-day trading. And in this way you will have a complete portfolio of strategies and robots to attack the mini-index from several fronts at the same time in day trading, thus increasing your chances
[22:46] of success. The link to the PS 3.0 method is here in the description of this video and also in the first pinned comment. So, in this possible setup, we will use the moving average, right, in conjunction with the FAMA moving average as an
[22:58] entry point. So, when we have a buy entry signal and... If the moving will use this moving average region to buy. And when the strategy gives a sell signal, we will use this region here,
[23:11] look, of the moving averages, when they are in red, as resistance. So , the entry point. The Doncha channel will show us the strength of the movement. So, if the price is here, attacking the upper part
[23:25] of the Doncha channel, we will believe that the upward trend has strength. And when the price starts attacking the lower part of the channel, we will believe that the downward trend has strength. And to confirm the strength of the trend, that's where
[23:38] the Arum Oscillator comes in. If the bars of the Arum Oscillator indicator are below here, look, this horizontal line of -70, it means that we have a strong downward trend. And of course, if the bars of the Arum Oscillator
[23:51] are above the 70 level, it means that we have a strong delta trend. This is the function of the indicators in this possible setup. And this possible setup would work as follows. In this way, if the price hits the
[24:04] bottom of the Donch channel, as it did here, look, right at the beginning of the trading session, it hit the bottom of the Donch channel, with the Arum oscillator below here, look, at -70, we can then place our sell order at the
[24:17] 's red. And then in that case, we would sell at that point, look, and the price would take this trade Again, I'm using a 300-point stop loss and a 150-point target. I
[24:30] This, I repeat, is my trading profile; it doesn't mean you the first profit of the day here. And then I would wait for another touch of the price at the top of the Donch channel. It ended up happening here, look, a touch at the
[24:46] Arum oscillator wasn't above the horizontal line, so we wouldn't do anything. After that, the price touches the black part of Doncha again, with the Arum Oscillator above the 70 level here. Look how you can see. So now I
[25:00] moving average because it's blue, as you can see. I would follow the blue moving average. When the price retraced to the blue moving average, I would be there buying, believing that the price would start to rise again and
[25:13] exiting the trade. And here I would have hit my daily positive target on April 23rd. And then I would go to the previous trading day , which is the 22nd. Look, the price touched the lower part of the Doncha channel here at the beginning. Further
[25:26] ahead it also touched the lower part of the Doncha channel. However, if you observe carefully, the Arum Oscillator never showed a downward trend. At no point did it go below -70, only
[25:38] later did this happen. Notice that this candle touches the lower part of the Doncha channel, with the Arum Oscillator below the -70 level. So, when the price retraces... Here on the moving average table, we could be
[25:51] Look, our sell order would be executed at this point, and up here the price hits our stop-loss. That would be the daily limit hit on April 22nd. April 21st. Look, on April 21st I see that we would have a
[26:06] That's because the price touches the lower part of the Doncha channel. With the Arum oscillator, look, below the -70 level, when the price retraces to the moving average, we sell. So, our sell order would be executed here, and down here,
[26:19] would be the first gain of the day, April 20th, right? The next signal that was executed here on April 20th was further ahead. Look right here at this point. That's because the price, look, touches the upper part of the Doncha channel, with
[26:32] the Arum oscillator above 70. So we would buy at the moving average. On the would then be triggered at that point. And up here, look, the price is already exiting the trade. That would be the second gain of the day. And on April 20th, we
[26:45] would have hit our positive target. And now we turn our attention to the in reality, which would be the trading session of April 17th. And on April 17th, we only had an entry signal down here, look, a sell signal
[26:59] lower part of the Donch channel. With the Arum oscillator below -70, we could then sell on the moving average table. Our sell order was then look, the price is exiting the trade, that would be the first gain of the day on
[27:15] make would be right here, look, another sell trade. This is because the price Donch channel, with the Arum, look, below the -70 level. If you If you want, red, look. And the top horizontal line, you can make it
[27:31] green. Anyway, we could then sell at the moving average table, since the price touched the bottom of the Donch channel, with the Arum below executed at this point, and this would be
[27:46] hit. So, this is how this second possible setup works. We wait for the price to gain strength in a certain direction and then we attack the price in the resistance zone generated by the moving average table in conjunction
[27:59] with the Fama moving average. So we would also sell here, look, on April 16th, which would be the trading day before what I just showed you, the down here. Look, the price gets out of the trade, which would then be the first profit of the
[28:12] day. After that, the price touches the part The bottom of the Don channel is back again, returning to the moving average table, and here, look, with the Arum supporting us, we would sell here. Look, at this point, the price would rise, it wouldn't hit our stop loss, and when it
[28:24] falls again, we would exit the trade. It would be the second profit of the day. Metapositiv hit here on April 16th. I'll finish doing the backtests here in April for you. Ready. Look at this, man. In April we had 1650 points, 21
[28:39] wins, five stop losses, and the success rate in April was 80.7% . I repeat, this is one possible setup. I have no idea if this actually works. To have concrete information about this, I would need to
[28:52] backtest data from previous months to determine if this is a worthwhile strategy or not. Until I do this, or until you do this, the setup I just showed you is nothing more than a possible
[29:05] strategy. I only wanted to show you one possibility, you know, of how to use the moving average table in conjunction with the moving average here as well. thoroughly and draw your own conclusions. How do I download and install the
[29:19] moving average table in Profit Chart? Hey, listen up now. The moving average table is a bonus that I'm giving away for free to those who participate in my Telegram group, VIP Pilsar 3.0 list. And in that group, I've also already submitted the
[29:33] Calfman moving average. I also delivered the efficiency index indicator, among other bonuses. And now, as a free bonus within this group, you also receive the table moving average indicator file , ready for you to install in
[29:47] Profit Chart. To download this file, simply click the first link in the description, join the Telegram group, and you'll find the table moving average file there. After you download the file, open Profit
[30:00] Chart. At the top you will find strategies. Click on the import/export bar. Select a moving average file, right, that you just downloaded. Click on that little arrow to the side and then click on import. You
[30:13] will see successfully imported strategies. After that, all you have to do is go to indicators, more indicators, search for "table" and you'll see "moving average table pill trader" and then you insert it into your chart. That's it,
[30:27] simple as that. Now it's your turn, buddy, play around with these two averages, test just the Mesa moving average or just the Fama moving average, or use both averages. Try different timeframes and different assets. I've already shown you that in the
[30:41] past, this moving average, combined with my Harbor Range strategy, has made me a lot of money. So, who knows, with this moving average you might discover a setup that perfectly fits your trading profile. Who knows, maybe
[30:55] this moving average will become one of the tools that will accompany you for years in your life as a day trader. You 'll only know if you try it. So I repeat, the average table is free in the Pilsar 3.0 VIP list group. The link is
[31:08] in the description of this video and also in the first pinned comment. And I really put in the effort to bring you this well-structured average. So, please leave a like, subscribe to this channel with notifications activated,
[31:21] because I won't rest until you become a successful trader. I'll be staying here, man, and see you in the next video. These are the strategies from the Next version, meaning they are the new Pilsar strategies
[31:35] that utilize the Pilsar indicator and coloring . And another interesting thing is that all of these strategies here are automated. When you get to this module back here, look, robot settings, you'll
[31:49] find the Pilsar 400 Next version robot, you 'll also find the Pilsar 500 Next version robot, the 600 Next version robot, and also the Pilsar 700 Next version robot. Yeah.
⚡ Saved you 0h 32m reading this? Transcribe any YouTube video for free — no signup needed.