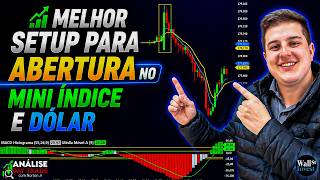

Markets Plummet: Tariff Shock Hits Brazil
45sHigh-impact opening with dramatic market drops and tariff news grabs immediate attention.
▶ Play Clip"Title promises the best setup for opening in mini-index and dollar, and the video delivers detailed strategies, though it also covers broader market analysis."
The video provides a detailed analysis of a day in the Brazilian and international financial markets, focusing on the mini-index drop driven by US tariff increases on Brazil. The presenter shares specific trading strategies, including moving average crossovers and inside bars, and reviews market movements for assets like gold, oil, and the S&P 500.
Global markets are plummeting; the Brazilian mini-index is down about 2% due to US tariff increases on Brazil. Vale, Petrobras, and banks are major contributors to the drop.
Retail sales data released at 9 AM came in below expectations, initially causing a bullish candle, but the market later turned negative due to tariff concerns.
Exceptions were made for coffee, meat, and aircraft components, but the market still reacted negatively.
The presenter made several trades using moving average crossovers and inside bars, noting that the day was good for trading despite the overall decline.
S&P 500 down 0.7%, NASDAQ down 1.8%, oil down 1.4%, gold down 2%.
Consumer confidence figures to be released tomorrow; if below expectations, it could boost the market as less spending implies lower inflation.
Vale down 2.2%, Petrobras 1.4%, Itaú 1.5%, Copel almost 3%. Banco do Brasil is the only bank rising.
In August 2025, a similar tariff increase caused a 2.5% drop in the mini-index; today's drop is smaller (25% tariff vs 50% then).
The presenter explains the 'Oingo Boingo' strategy for trading the market opening, which should only be used when there is no important news at 9:30 AM.
On a 5-minute chart, if the second candle breaks the high of the first, enter a short position with stop loss above the first candle's high. Success rate around 70%.
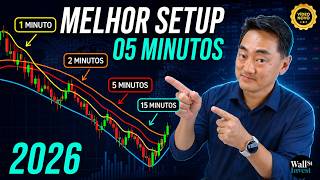
On trending days, use traditional 620-period exponential moving average crossovers. On news days, use shifted moving averages.
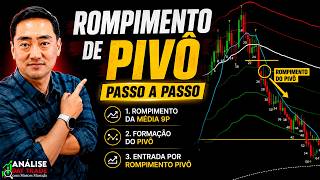
Entered short when price pulled back to the 6-period moving average after a crossover. Stop loss 100 points above the 20-period moving average, proportional target 1:1.
Inside bar at candle 22; when candle 23 broke the high, it triggered a buy signal. Stop loss 100 points below the average of the candle, proportional target 1:1.
Out of six inside bar trades, four were winners. The market was trending, making inside bars effective.
Magnificent eight stocks: Amazon down 2%, Google down 4%, Target down 2.5%, Microsoft and Apple rising, NVIDIA and Tesla crashing.
Gold fell below $4,000 per ounce, testing support. Oil down 1.46% to around $83 per barrel due to geopolitical tensions.
Used traditional moving averages on S&P 500; entered when price returned to the 26-period moving average on a 5-minute chart. Stop loss below 20-period moving average.
Gold is very volatile; use shifted moving averages for earlier entry. VIP bands are not respected by gold and oil.
S&P 500 respects VIP bands; used Tour Hand on a 20-period scale to measure stop-loss size (7 points).
The video emphasizes that despite market declines, specific trading strategies like moving average crossovers and inside bars can be profitable. The presenter also highlights the importance of adapting strategies to market conditions and avoiding trading during major news events.
What was the approximate drop in the Brazilian mini-index due to US tariff increases?
About 2%.
00:02
Which economic data release caused a bullish candle at the start of the day?
Retail sales data came in below expectations.
00:47
Name three sectors that contributed to the mini-index fall in Brazil.
Vale, Petrobras, and banks.
00:18
What is the success rate of the 'Oingo Boingo' opening strategy?
Around 70%.
06:26
When should the 'Oingo Boingo' strategy NOT be used?
When there is important news at 9:30 AM.
04:53
What moving average period does the presenter prefer for trending markets?
620-period exponential moving average.
07:48
How many entries per crossover does the presenter recommend?
A maximum of two entries per crossover.
09:27
What is the stop loss placement for the moving average crossover strategy?
100 points above the 20-period moving average.
08:57
What is an inside bar?
A candle whose high and low are within the range of the previous candle.
10:46
What was the approximate drop in gold price mentioned?
2%, falling below $4,000 per ounce.
14:11
Which US stocks were rising while others fell?
Microsoft and Apple were rising.
13:56
What is the recommended stop loss for inside bar trades?
Approximately 100 points below the average of the inside bar candle.
11:14
Why does the presenter avoid trading before 10 AM for moving average crossovers?
Because before 10 AM, the market is too volatile and triggers stop-loss orders.
08:44
What is the proportional target used in the strategies?
One-to-one (1:1).
09:12
Which assets does the presenter say do not respect VIP bands?
Gold and oil.
17:26
Market Decline Triggered by Tariffs
Sets the context for the entire video: global and Brazilian markets falling due to US tariff increases.
00:02Oingo Boingo Opening Strategy
A specific, actionable trading strategy with a 70% success rate, applicable only on non-news days.
04:41Moving Average Crossover for Trending Markets
Demonstrates how to adapt moving average periods (620) to trending conditions for better entries.
07:48Inside Bar Reversal Pattern
Explains a reliable pattern for entry with clear stop loss and target rules, yielding 4 out of 6 wins.
10:46Gold Below $4,000 Support
Key price level for gold, indicating potential further decline or bounce, relevant for traders.
14:11[00:02] Norton, and today markets around the world are plummeting, but here in Brazil the mini-index is falling quite a bit, by about 2%, driven by the issue of tariff increases imposed by the United States on Brazil. This drop here
[00:18] in Brazil is being driven by several companies, among them Vale is falling by more than 2%, Petrobras is falling driven by the drop in the price of crude oil, which is at the moment, which accelerates Petrobras' shares, and the banks here in Brazil, which are
[00:32] Brazilian financial system, are also falling quite a bit. So when you add Petrobras, Vale, and the banks, with companies falling, that ends up pushing the mini-index down as well. So much so that the mini-index opened higher, but in fact, the
[00:47] released at 9:00 AM sharp, came in below expectations. In other words, people are spending less, fewer people spending means less inflation, lower stock market has a bullish candle at the start of the day. The problem came later,
[01:03] right? Even with the tariffs, there were several exceptions regarding coffee, meat, and components needed to produce aircraft, right? So, a lot of things were exempted, but even so, the market reacted in a very
[01:17] negative way. But today was a very good day for trading for those who made several trades using moving average crossovers, using inside bars, even in the live stream I we made several trades and it was also super interesting to analyze the entries
[01:30] using side bars, reversals, trend continuation, right? But the global market is also falling, right? That 's why the SP500 is down about 0.7%, 's why the SP500 is down about 0.7%, 7%, the NASDAQ index is down 1.8%,
[01:42] and also, in the case of oil as I mentioned to you, it's down about 1.4%, and gold is down about 2% today as well, okay? And actually, regarding the concern, even though oil prices are falling, this rise in
[01:56] Brazil and the United States. That's why the market didn't experience that major change either, right? And besides , folks, the consumer confidence figures are going to be released tomorrow , right? How confident are consumers in the market?
[02:10] If expectations fall short, it could boost the market a bit; people will stop spending because they're less confident, meaning the stock market tends to rise as well. without any major news, which also has a significant impact on the market, right?
[02:23] And first of all, folks, today is the third day of straight to the point. You can the screen, the link is in my WhatsApp description, and the American market course starts next week. Also, folks, at the end of the month we'll be opening
[02:37] The link is also in the description. It will be on the 28th, 29th, and 30th of July, now move on to today's next video. Leave a like, comment below, most importantly, your comment is valuable. Criticism, praise, and suggestions are always
[02:52] today's video. Okay everyone, I'm here on the Profit Pro platform from so you can download it for free if you have an account with Touro Brokerage. So, open your account to get
[03:07] analyze the chart, it's quite clear that we saw a very strong downward movement today. Let's first analyze which stocks went up and which went down today. Vale is down approximately 2.2%, Petrobras 1.4%,
[03:20] down approximately 2.2%, Petrobras 1.4%, Itaú 1.5%, and Copel almost 3%. Banco do are rising, the only bank that is rising. Banco do Brasil is up, but while Bradesco is down, uh, that bank too, we have BTG bank, it's also down by about 1%
[03:33] major banks in Brazil are falling here, Santander is falling too, right? So you can see significant influence on the fall of the mini- index, right? The last time there was news about the tariff increase that the United States imposed on Brazil was in
[03:47] August 2025. If we look at the chart here, to see how the market behaved, look at the IBOV chart here, it was August 2025, sharp drop in the mini-index on the day the tariff increase was announced; the mini-index fell by
[04:00] about 2.5%, right? It was even worse than today. Actually, the rate was 50%, now it's 25%, so it's not such a big drop. In terms of points, it was a bigger drop, right? But here, in reality,
[04:13] is actually much higher than it was in August of arrived here at the beginning of the day, the first giant candle of the day, right? In terms of Kando points, which is a more routine form of movement here. If we look at
[04:27] today's economic calendar, folks, it was released yesterday, so this producer price was announced , which is good news, and that's why the market had this bullish candle right at the beginning of the day. Okay guys, even the title of this video is going to
[04:41] be "How to operate the opening in day trading," okay? There's a technique I really like to use, and I've done it several times. With these patients, I did Thursday this week. Because, as I always tell you, the market opening operation
[04:53] , which I call Oingo Boingo, is the operation you should only do when there's no important news at 9:30 in the morning, okay? 9, 9:30, 10 o'clock, very volatile at those times and triggers stop-loss orders, everything goes wrong. That's why,
[05:06] if you had traded the Ingo Boingo yesterday and the day before, you would have had a loss, right? But strong news at the start of the day, there was retail sales data, but if you compare retail sales news with inflation, well, nothing compares. How was my
[05:19] Always a 5-minute chart. If the second keno of the day, which is this second keno, breaks the high of the first keno of the day, this is only on a 5-minute chart , okay everyone? I'm going in blind. The moment he breaks the high, I'll already be shorting the position
[05:32] . There's no point in waiting for K number two to close. I'm placing my stop-loss order above the first candle's reading, and a proportional stop-loss order as well, which is showing around 500, 485 points, so that
[05:46] 's the stop-loss order . So, according to what happened that day, it broke through the maximum, without everything being sold, top game positions and top loss positions. Today was a day when it even went negative, at most R$0 points, it didn't even go negative R$30
[05:58] , right? Then the market came here, and later, within the same candle, it game. Hey Norte, if I had gone in short here, I would have sold at the day's high. If I had gone through with the operation, I would have earned much more. You
[06:12] in the whole world has a crystal ball to know how far the market will go, right? this, I would have let the operation run its course. Instead of earning 500 points there, I would have gotten 2,500 points, I would have gotten much more. But since that's not our case, or
[06:26] rather, nobody in the world, right? Well, the market experienced this kind of movement here. It's a very good operation; its success rate is around 70%. And I've been using it since 2019, this operation every morning, except for those news days,
[06:41] post-news days. For example, uh, Daniel Vorcar is going to give a plea bargain, right? The United States bombs Iran more heavily and completely closes the two straits. Iran to pass through. The United States is
[06:54] ships are passing by. So, the price of oil is falling because of this, passing through. For example, European ships, Middle Eastern ships, Bahraini ships, Saudi Arabian ships, and even ships from the United Arab Emirates are passing through there
[07:08] 's allowed over there. That's why the oil price didn't get any worse than it already was, right? It . So today, folks, instead of using shifted moving averages , which I usually do, I used traditional moving averages today, unlike the last few days.
[07:23] As I've reiterated several times here on the channel, what do I mean by that? You use shifted moving averages more when the market is more example, a payroll report, a Super Wednesday, right? One day of inflation,
[07:36] you use this out of place. But on days when the market is trending very mildly, like today was, right? With several pullbacks, a very clear trend, using the 620-day moving average signal ends up being more interesting. So what did
[07:48] I do? I was even analyzing it with the guys on the live stream today. Average crossover 620-period exponential moving average. It crossed downwards, two bearish candles, 7 and 8. And for the MACD two bearish candles, 7 and 8. And for the MACD I use the default configuration of 26, 12, and 9.
[08:02] I put a coloring rule called "2 Standard Moving Averages on top of the MACD," okay ? So he crossed over, two falling kenos, the seven and the eight, right? Hey, entry point was for this to happen here on candle 16, okay? It was precisely when
[08:17] the price made a pullback to the moving average that I entered a short position when the market returned to the six-period moving average. In that case, ah, using 921 also works. 721 also works. I prefer using 620 rather than 921 or 71; I
[08:30] think that's a bit outdated, right? But I like using 620, which I like to use, I I learned to trade, folks, back in 2015 or 2016, right? And it still works very well to this day, right? Sure, except during pandemic times, right? Right?
[08:44] Then people ask: "No, why did or candle 11 when they returned to the moving average?" Because moving average crossovers are not performed before 10 AM. Generally, before 10 AM the
[08:57] 's a good idea to wait for the message to travel a little further. So he made the sale here. Stop loss 100 points above the 20-period moving average, which would give you roughly 500 points, and a proportional target of one to one, right? Today, there was no trouble at
[09:12] any point except on candle 16. Then, on candle 17, and on candle 18, it already triggered the stop-loss order. entered at candle 18 as well, there wouldn't have been a problem. Any of those problem. I always make a maximum of two entries per intersection. A
[09:27] maximum of two entries per intersection. Nora, would you come back here to the kand 25 that he returned to the average? No. First of all, I make two entries per high crossover or another low crossover, okay? MCED began
[09:41] like using Viop Bands, which I also like to use, the market after the market has already fallen all this way is a bit risky. Not a little, very risky, right? Nothing will fall further than his empire.
[09:55] There are days when it drops even further, falling 3 or 4%, right? But nowadays, most of the time, it doesn't reach that point that often, okay? For those who used the VIP bands today, folks, he practically didn't respect any of the views, except for the third band he almost
[10:08] played with, you know? It didn't actually come to be respected , but the market ended up changing its course as well, okay? Well, regarding the trade, so to speak, for those who have used the quite a lot in my day-to-day trading, there's a layout here that I created specifically for the
[10:21] side bar; I don't usually use it all the time, you know? Well, I don't usually use it before 10 AM, only between 10 AM and 5 PM and when the market is . Why didn't I use the candle, why didn't I trade on candle 4,
[10:34] 8, or 10? Here are three Kendles that would make a good game, right? Because they were candles that indicated a drop. I 'll explain why in a moment. Well, because I AM. My first entry was here on candle 15, which unfortunately
[10:46] triggered a stop loss, but I was even commenting with people on the live stream that this keno at 22 here was an inside bar keno, a reversal pattern. Ken 23 broke through the inside bar high, triggering a buy signal. The inside bar is this Kendle 22 here, okay?
[10:59] previous candle. So, that Kand 22 was an inside bar, and 23 broke the inside bar maxim. If the 23 had broken the low of the inside bar, I would have gone high, I would have bought. Stop loss approximately 100 points below the average of the candle
[11:14] proportional target is usually used for a one- to-one approach. Then, if you want to trade targets at test them one by one to see if you adapt to it, okay? So I left the stop loss relatively well positioned, right? If he had given a
[11:28] sell signal here on Keno 23, I wouldn't have gone short, even though he was signaling that the market might fall. Because, folks, if you analyze it from a market context. Wow, the market has already dropped 3,000 points, it's very close to the
[11:41] usually has difficulty breaking through when it hits the third band. 'll see that the price is having a lot of difficulty, right? So here, let me go back to the . Here are some other inside bars, right? There's a buy sidebar here, a
[11:56] here, a sell sidebar, right? An inside bar for sales, a side bar for he made inside the bar today, folks, were more or less around six trades. Out of six, four won the game, right? And remember that it's good to avoid
[12:10] market was trending, so today was fantastic for trading the inside bar. For those who trade smaller options, the inside bar is also very interesting, okay? So much so that he formed an inside bar right at the peak of the day. What broke through the minimum
[12:23] sell entry above this high here and the proportional target is one to one in 65. The thousand it's usually been somewhat sideways in recent days, right? But after it seemed like it was resistance zone and created a downward movement here as well, okay? OK.
[12:39] international market, which also fell today, right? Okay, folks, analyzing the international market, we 're here on the Black Air platform from the FX Globe brokerage, which is the brokerage I use to trade international markets
[12:52] , okay? Hey guys, they're having a promotion this Sunday, which is also my birthday, July 19th. I'm going to have a really cool giveaway for those who
[13:04] like to trade in the international market because of the World Cup final. for you guys, right? Guess the answer and enter the iPhone 17 Pro Max giveaway, okay? So, we have the minimum criteria here, right? Deposit, just do a little transaction
[13:17] there, right? And I'll leave the link here in the description so you can participate in the iPhone 17 Pro Max giveaway, okay? I'll show you step-by-step what make your trades and maybe even win some money, right? I don't know what the result will be
[13:30] , nobody really knows, right? But I've already made my guess, okay? OK. SP500 market here, right? Yes, the Black Air platform is free. I'll also leave the link here for you to download
[13:43] The platform is only free if you have a balance of $, okay? So let's go. Hey guys, we have the SP500 here, okay? Which also fell today by approximately 0.6%. Now things have really taken a turn here. In fact, if we look at
[13:56] American stocks, the so-called magnificent eight, several stocks fall quite significantly. Amazon down 2% , Google down 4%, target 2.5%, Microsoft is rising along with Apple, right? NVIDIA crashes, SpaceX crashes, and Tesla crashes too. So you see that several
[14:11] US stocks are falling sharply, right? This pushes the SP500 down. Meanwhile, the Nasdaq, the American technology index, is down 1.7% . Gold falls 2%, dropping below 4,000 per ounce. It's a very difficult support to break, but
[14:26] that region is starting to sag, right? There was support there on July 13th, there was support on July 8th at 4,000, and at the very end of June there was also support, hitting 3,940 at the end of June, then
[14:39] returning to 4,200, right? So, in recent days, gold has been trading fairly sideways near $000 an ounce. Oil, on the other hand, is down 1.46%, bringing the price of a barrel back to around 83 , right? He was there that week, at the
[14:54] beginning of the month, actually he was around $70, right? It's already gone up about 18% since the low it hit at the beginning of this month, because it's still the some ships are passing through, US allies are passing through, but you know
[15:10] , uh, there's still a strong conflict there, bombing, right, even from yesterday morning to today, the United States, actually, Iran told Yemen, right, the H, right, that it's fire, as if it
[15:24] were the Iranian Revolutionary Guard . Uh, if the United States closes . Uh, if the United States closes Yemen's internet connections, they will close access to the Red Sea. That makes it much more complicated. That complicates
[15:37] access to Europe, doesn't it? There are some African countries over there, so it gets quite dangerous there uncertainty regarding oil. Let's talk about operations here, folks. strong market trend, it was also possible to use traditional moving averages on the
[15:51] SP500 index. At practically the same time, we here in Brazil, around 9 a little earlier, actually at 8 in the morning, the market was already falling sharply, right? Around 10:40, it accelerated its decline,
[16:03] crossed upwards, so much so that it produced two bullish candles here, one from the Moving Average, and the price returned to the 26-period moving average on candle 137. Remember that in the international market you can trade 0.01 lots, which we usually call a
[16:16] microlot, right? And the MACJ is also in the default setting of 269, as it operates on the 5-minute chart, right? He made two entries here, in 137 and 138 as well, okay? When the market pulls back to the average, the stop loss should be placed slightly below
[16:30] the 20-period moving average, right? A little leeway there and a proportional one-to- one target. OK? He made two very interesting entries here. And here it crossed downwards, two bearish candles, entry when the price returns to the
[16:43] moving average here on candle 163. That was a close call, huh? Stop a couple of points higher, which would give us a place roughly here. Okay , so this is the SP500 chart, margin of two or three points in relation to the 20-period moving average, which I mentioned is around 100 to 120 points for the mini-
[16:57] index here in Brazil, then the market started riding the wave quite a bit as well. The Nasdaq fared better, as it fell much more than the S&P 500, right? He fell and never came back, right? The movement was very
[17:10] . Gold is a very volatile asset to trade. So using use shifted moving averages on gold, which is a very volatile asset. So them is shifted forward by one period, which in this case is purple here, right? It's one of the
[17:26] earlier entry into highly volatile assets, such as It works very well. As for the VIP bands on those assets, forget it, gold and oil don't respect VIP bands, okay? If we take the SP500 here, for example,
[17:40] He even showed respect a little while ago, look, the second Vap band bought it. I use Tour Hand on a 20-period scale to measure stop-loss size. For example, I would have bought here at 202, the TR range at the time was showing seven points, stop loss at a
[17:53] maximum of seven points and a proportional target also one to one, okay? OK, everyone. So Nasdaq also has to be very careful with the FP bands, third band and didn't even look back. Sure, he was trying to break up several
[18:08] times. He tried to break up several times until he finally did, you know, for good, but he's very respectful too. Not quite as good as an SP500 or a Jones, but it's still impressive in a way. I would operate the steam engines, only 500 from Jones. Nasc would
[18:20] also operate the displaced moving average in Sadar. And in oil and gold, more operations would be carried out as well, right everyone? this video from Narries. Don't forget to leave a like. Don't forget about the promotion, okay
[18:32] everyone? So you can also enter to win an iPhone 17 Pro Max. Here are two links for free access, and also the link for you to access the championship there, right? It's that betting pool for the draw at the end of the World Cup, okay? Thank you
[18:45] Guys, next week there's a course on the American market on July 21st. month, on July 28th, the point-of-sale trading course also begins. Thank you all very much, and see you in our next class. Most importantly, leave a comment,
[18:59] like the video, subscribe to the channel, and see you later.

⚡ Saved you 0h 19m reading this? Transcribe any YouTube video for free — no signup needed.