
AI Summary
This video introduces the concept of order flow candles as a more advanced alternative to traditional candlestick charts, which the creator argues are outdated. It demonstrates how to enable the volume footprint feature on TradingView and explains how to interpret the resulting visual data to identify potential market reversals.
Chapters
The video claims that standard candlesticks, which date back to the 1800s and were created by a rice farmer, only provide basic information like open, close, high, and low.
An order flow candle provides a deeper insight into every single order that entered the market within that candle's timeframe, unlike traditional candles.
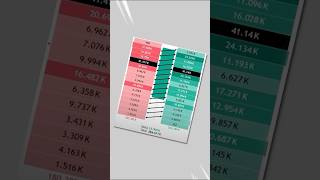
On TradingView, navigate to your chart, click the candlestick icon, scroll down, and select 'volume footprint' to change the appearance of all candles.
A green candle with high buying volume (green rectangles on the right) indicates buyers accepted paying higher prices throughout, even at the top, suggesting prices are likely to keep rising.
A green candle with red rectangles on the top left shows 'absorption' at the top. This indicates buyers are trying to push the price up, but a large seller is absorbing their orders, signaling that sellers may be starting to take control.
Order flow analysis on TradingView can provide a more nuanced view of market dynamics than traditional candlesticks, potentially revealing early signs of trend reversals through patterns like absorption.
Mentioned in this Video
Tutorial Checklist
Study Flashcards (5)
What is the primary limitation of traditional candlestick charts?
easy
Click to reveal answer
What is the primary limitation of traditional candlestick charts?
They only provide basic information like open, close, high, or low.
00:01
What does an order flow candle show that a traditional candle does not?
medium
Click to reveal answer
What does an order flow candle show that a traditional candle does not?
It shows the deeper story of every single order that entered the market within that candle.
00:16
How do you enable the volume footprint on TradingView?
medium
Click to reveal answer
How do you enable the volume footprint on TradingView?
Click the candlestick icon on the chart, scroll down, and select 'volume footprint'.
00:29
What does a green candle with high buying volume (green rectangles on the right) indicate?
medium
Click to reveal answer
What does a green candle with high buying volume (green rectangles on the right) indicate?
It indicates buyers accepted paying higher prices the whole time, suggesting prices are likely to keep rising.
00:43
What does 'absorption' at the top of a candle indicate?
hard
Click to reveal answer
What does 'absorption' at the top of a candle indicate?
It indicates buyers are trying to push the price up, but a big seller is absorbing them, suggesting sellers may be starting to take control.
00:56
💡 Key Takeaways
The Outdated Nature of Candlesticks
It frames the entire video by challenging a foundational tool in trading, creating a need for a modern solution.
00:01The Promise of Order Flow
This is the core value proposition of the video, explaining the unique advantage of order flow analysis.
00:16The Absorption Pattern
This is the most actionable and specific trading signal provided, offering a concrete example of a potential reversal.
00:56Full Transcript
[00:01] 1800s by a rice farmer. In other words, they're very outdated. But in 2026, there's an invention that allows you to look even deeper into the candle with >> order flow. Instead of just giving you basic information like the open, close,
[00:16] high, or low, an order flow candle will tell you the deeper story of every single order that entered into the market within that candle. To do this, get on TradingView. If you don't yet have it, I'll leave a link in my bio. Go
[00:29] to your chart, click this candlestick icon, scroll down until you see the volume footprint. Now, all of your candles will look like this. A candle like this with a green color and high amounts of buying volume shown
[00:43] by these green rectangles on the right show buyers accepted paying higher prices the whole time, even at the top, which is a great indication that prices are likely to keep rising. But that completely changes if you see this
[00:56] scenario. This time we have the same green candle, but this time the order flow has red rectangles on the top left, showing absorption at the top of this candle, where buyers are trying to push up the price, but a big seller is
[01:10] absorbing them, which could be a great indication that sellers are starting to indication that sellers are starting to become in control.



![BEST MACD Trading Strategy [86% Win Rate]](https://img.youtube.com/vi/rf_EQvubKlk/mqdefault.jpg)