
AI Summary
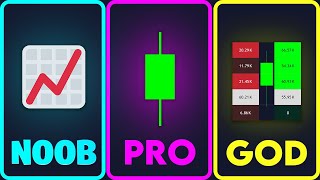
This video introduces order flow analysis as a way to gain deeper market insight beyond standard candlesticks. It explains the volume footprint, key metrics like Delta and imbalances, and how to combine them with CVD divergence for high-probability trades.
Chapters
Order flow is compared to having a cheat sheet of all bids before an auction, giving you an edge over other traders.
The volume footprint shows buy and sell volume at each price level, color-coded for quick analysis.
VAH and VAL define the 70% value area, useful for support/resistance.
Delta (buy volume minus sell volume) indicates who's in control.
Imbalances occur when one side has 3x more volume, signaling potential reversals.
Absorption and initiation candles confirm reversals when paired with imbalances.
CVD divergence (price vs. delta) reveals exhaustion and likely price direction.
A complete strategy: find demand zone, wait for absorption/initiation, confirm with CVD, then enter with stop and take profit.
Mentioned in this Video
Tutorial Checklist
Study Flashcards (6)
What is the Delta in order flow?
easy
Click to reveal answer
What is the Delta in order flow?
The difference between buy and sell volume.
00:03:36
What does VAH stand for and what does it represent?
medium
Click to reveal answer
What does VAH stand for and what does it represent?
The price level where 70% of the volume occurred.
00:03:05
What defines an imbalance in the volume footprint?
medium
Click to reveal answer
What defines an imbalance in the volume footprint?
When one side has at least 3x more volume than the other at a price level.
00:03:51
What is an absorption candle?
hard
Click to reveal answer
What is an absorption candle?
When price closes against the imbalance, showing the opposite side is absorbing the pressure.
00:05:54
What is an initiation candle?
hard
Click to reveal answer
What is an initiation candle?
When price closes in the direction of the imbalance, confirming directional intent.
00:06:08
What is delta divergence?
medium
Click to reveal answer
What is delta divergence?
When price makes lower lows but CVD makes higher lows, indicating seller exhaustion.
00:08:58
💡 Key Takeaways
Volume Footprint
Explains how to read the volume footprint, a core tool for order flow analysis.
00:01:36Delta as Control Indicator
Delta tells you who's in control, a key concept for predicting price moves.
00:03:36Imbalances as Reversal Signals
Imbalances are powerful predictors of reversals when combined with price action.
00:03:51CVD Divergence
CVD divergence adds a layer of confirmation, increasing trade probability.
00:08:06Full Transcript
[00:00] This is a candlestick. The foundation of trading. But to be honest, it doesn t give us very much information. What if we could enable a secret tool, where it gives us 10x the amount of data. But not only that.
[00:12] Telling us exactly who s in control. The buyers or the sellers. Who s likely to win. And if used correctly, tells us exactly what price is likely to do next? That would be pretty cool right? Introducing orderflow.
[00:25] Imagine going to one of those bidding auctions where they talk really fast. Now say while at this bidding auction, you simply sit in your chair and wait patiently to hear what the next person bids. And bid purely off that information alone.
[00:40] That s kind of what a normal candle stick is like. Very very limited. But instead, imagine before you go to this auction, you re sitting in the parking lot and some creepy guy in a trench coat hands you a sheet of paper of what every single
[00:53] bidder in that room is going to bid. So even before walking into that room, you know exactly what everyone is going to bid, what the average bid is, how many people are in that room, and most importantly where the final bid is likely to be priced at.
[01:08] Now I don t know about you, but I m grabbing that sheet of paper from that creepy guy. That sheet of paper .is called order flow. Now as a basic user when looking at your chart. You might see a candle that looks like. Now the only information we can really
[01:22] gather from this candle, is the buyers won the battle and price closed right here. So really, we re not seeing much. We re really only seeing the outcome. Not the actual story behind the candle. If we wanted to view this actual
[01:36] candlestick on a deeper level, we would enable whats called the volume footprint.
[01:51] Now I get it, when first looking at this it can look like the cockpit of f-22 fighter jet. There s a lot going on and to say the least, it looks pretty confusing. But its actually pretty simple. To break it down, the left side is the
[02:06] sell volume. The right side is the buy volum. The numbers within these boxes is simply the amount of volume executed at that specific price. So if we zoom in here. There was 1.68 million in sell volume executed at this specific price.
[02:22] While there was only 1.57 million in buy volume. so there were way more seller activity at this price compared to buying activity. Meaning sellers held control, while we were at this specific price. The volume footprint will color code these numbers
[02:36] for you so you can quickly identify whats what. The darker labeled metrics show price levels with lower volumes. The lighter colors show price levels with larger volumes. The metrics labeled white are the price levels with the highs amount of activity.
[02:50] So in this example, this was the price level with the highest amount of volume. And where buyers and sellers found fair value for the most part. This level can often be use for finding important support and resistance levels, but we re getting ahead of ourselves, we ll get to that later.
[03:05] And can be identified by these 2 white lines. The VAH (value area high) and is where 70% of the volume occurred. So this zone here, is where 70% of the
[03:22] volume from this specific candle occurred. This red number down here is the total of all the sell volume. This green number is the total of all the buy volume. The difference between these two is the Delta. The delta is a very key statistic because it tells
[03:36] us whos currently in control. The buyers or the sellers. control and there is more selling activity. If this number is green, that means the buyers are in control and there is more buying activity. The next metric is probably the most important
[03:51] one and is where we will generate a lot of our strategy from .and that is imbalances. These imbalances can be seen by these small red and green rectangles on the price level has at least 3x more volume compared to the one across from it.
[04:22] Its important to note that we don t compare price levels horizontally. We compare them diagonally like so. That s because when buyers attack sellers. They do that one price level above. When sellers attack buyers, they attack one price level below.
[04:37] So if we take a closer look. The sellers had 990,000 volume compared to the buyers only having 195,000 volume. Which is or more than 3x the amount. So in return, a small red rectangle
[04:51] or imbalance, is printed next to this number. If we use these imbalances correctly, we can predict exactly where price is likely to reverse. For example. If we have this candle right here. And There were a ton of buy imbalances at the top. Showing buying aggression. Price should in turn,
[05:07] close above these imbalances. Since there was a lot of buy volume up here, price should correlate with that and move up from these imblances. That s a healthy candle. buyers are being absorbed by the sellers. And the sellers are starting to take back control.
[05:25] down here. Price in theory, should close below these imbalances. Showing seller intent. If it doesn t, and price closes above these imbalances. That shows the
[05:37] sellers are being absorbed by the buyers. Now this can be a great tool to find when a reversal is ABOUT to happen. But it s not showing WHEN its actually happening. Thats why I added what I call.. the absorption initiation pattern. Or AIP for short. Yeah, I like the sound of that.
[05:54] So we went over the absorption scenario, but whats initiation? initiation is nothing more than the agreement between imbalances and price. So in essence. what the candle should be doing. So going back to our example, if we have buyer
[06:08] imbalances at the top of this candle. The price should close above these imbalances. Showing the imbalances held there weight and there is directional intent with the candle. Same goes for selling. If we have multiple seller imbalances, price should be closing below these
[06:22] imbalances to show directional intent. If we pair the absorption candle with the initiation candle. We can get some scary good reversal predictions. As price starts approaching this area of demand, we see price closing below
[06:38] imbalances. Which in turn, agrees with the idea of selling directional intent. As price gets closer to this area of demand though, We see an absorption candle. where price closed above are seller imbalances. So the moment price hit our area of demand,
[06:52] buyers stepped in and start fighting off the sellers aggressively. Directly after that, we see an initiation candle. Where the candle closed above the buyer imbalances. Showing buyers now have directional intent.
[07:04] So if we pair these 3 powerful tools. A strong key demand zone, an absorption candle, and an initiation candle showing confirmation. We can find some mind blowing reversal areas where price is very likely to reverse. and in return, we make millions of dollars.
[07:20] have an absorption candle printed, then directly after an initiation candle printed. But that doesn t always mean, price will react the way we think it will react.
[07:32] So we have to find a way to raise the probability even more. The delta is simply the difference between ask and bid volume. If we have a negative delta, that means we have more selling volume.
[07:49] A bullish candle usually has a positive delta, a bearish candle usually has a negative delta. But this isn t always the case. You can have a red candle, with a positive delta. And that my friends is called delta divergence. Delta divergence is a sign of absorption.
[08:06] And to take advantage of this scenario, we are going to use a little tool called the crv Which is the cumulative volume delta. To do this go to your indicators tab,
[08:19] and search cumulative volume delta. So to break it down, if price is making higher highs. But the cvd is making lower lows. This means even though price is going higher, the delta is going lower.
[08:34] Which means buyers are getting exhausted, and price is likely to fade out and head lower. Corresponding to that, if price is making lower highs, and the cvd is making higher highs.
[08:46] Which price is also likely head lower. The opposite of this also true. If price is making lower lows, but the cvd is making higher lows.
[08:58] That means the sellers are losing steam and price is likely to head upwards. Same goes with if the price is making higher lows, but the cvd is making lower lows. by the buyers. So price is likely to go up. So now were not only looking at what the current
[09:16] market is doing, but we re also adding a layer of divergence to see what s likely to happen. If we use this in coordination with everything we just talked about, we can get a mindblowing prediction of what price is likely to do next, and on top of that. It s extremely accurate.
[09:32] To do this, we are going to go on the 4 hour timeframe. This strategy will work on all timeframes but I personally like to use it on higher timeframes. To start us off, we need to find a key level of demand.
[09:49] So here, this strong upwards move started from this candle. So we ll mark from the bottom of this candle to the top of this candle. This is our area of demand.
[10:01] Next, we wait for price to come back down to our area of demand. Now instead of entering as soon as price enters our demand zone and just guessing that it will go up. We are going to use the volume footprint to read the room and see what
[10:14] buyers and sellers are thinking while in this zone. To see if it will respect it or not. To do this, go to tradingview. If you don t yet have it ill leave a link in my description. Go to the top here. Select this candle icon. The scroll down till you see volume footprint.
[10:29] Next. We ll zoom into the candles inside our demand zone. First, notice how there is a seller imbalance down here. Saying there were a lot of sellers
[10:45] down here at this price. But also notice, how this specific candle closed above this imbalance. Showing the sellers are getting absorbed by the buyers. Notice on this candle, theres now a buyer imbalance.
[11:00] Also notice how price closed above this imbalance. This is our initiation candle. And it shows buyers for the buyers in this demand zone. Next we go to our indicators tab, search cvd.
[11:12] So there is something very interesting going on. Notice how the price is going down, making lower lows. So in return, the cvd should be going down,
[11:24] just like the price. But its not. Its making higher lows. Which means. Theres delta divergence. And is once again, a sign that the sellers We found a key level of demand. By finding the start of a strong move on a higher timeframe.
[11:41] We then turned on the volume footprint to see if price was respecting our zone. We got an absorption candle, then directly after an initiation candle. Then we checked the cvd, and saw there was delta divergence. Also showing the
[11:59] So we enter here. Set our stop below the area of demand and set our take profit at the highs. And just as we predicted price does exactly what we thought it would. And hits our take profit.
[12:12] Actually, before I even entered into this trade. I posted it in my newsletter. Its basically a newletter where I share my trade, important news, and overall just really good place for trading knowledge. The best part is, its absolutely free. If
[12:26] Well, that s how to use orderflow correctly. Try implementing this in your trading and let me know see you guys next time. To do this, go to tradingview. If you don
[12:43] up here. Scroll down, and click on volume footprint.



![BEST MACD Trading Strategy [86% Win Rate]](https://img.youtube.com/vi/rf_EQvubKlk/mqdefault.jpg)