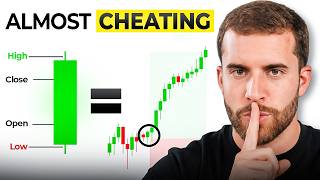
Why 99% of Traders Fail
51sRelatable frustration and eye-opening insight on market body language.
▶ Play Clip"Delivers a solid foundation in price action concepts, though some sections feel like filler and the community plug is heavy."
This video explains price action trading, teaching traders how to interpret market movements through candlesticks, wicks, and patterns. The presenter covers strong vs weak candlesticks, rejection vs wick fill, and reversal and breakout patterns, emphasizing the importance of context and confirmation.
Price action is the non-verbal communication of the market, like body language. Every high, low, open, and close tells a story.
Strength is determined by placement at key support/resistance levels, not size. A small rejection candle at a level can be stronger than a large impulsive candle in the middle of nowhere.
Wicks represent price trails. A rejection wick shows the market tried to break a level but failed. A wick fill is a retracement that fills the wick in the direction of the trade.
A head and shoulders pattern forms at market tops. It is only valid after a structure shift (breaking the previous higher low). Never anticipate; wait for confirmation.
Continuation patterns where price breaks a consolidation zone. The best entry is on retest with rejection confirmation, reducing fakeouts.
Waiting for retest and rejection candlesticks increases win probability. Consistent rules lead to consistent results.
Price action is the language of the markets; once understood, traders can identify high-probability setups by reading candlesticks, wicks, and patterns in the context of key levels and structure.
What is price action?
The non-verbal communication of the market, where every high, low, open, and close conveys information.
00:52
What determines a strong candlestick?
Its placement at a key support or resistance level, not its size.
02:08
What is a rejection wick?
A wick where price tried to break a level but failed, then reversed in the opposite direction.
08:42
What is a wick fill?
A retracement that fills the wick in the direction of the intended trade, often at a higher time frame support level.
10:14
When should you enter a head and shoulders trade?
After the structure has shifted (break of previous higher low) confirming the pattern, not in anticipation.
17:08
What is a breakout pattern?
A continuation pattern where price breaks a consolidation zone, then retests before continuing.
19:36
What is the recommended entry for a breakout pattern?
Wait for the retest with rejection candlesticks to avoid fakeouts.
22:08
Context Over Size
Challenges the common misconception that large candlesticks are strong, emphasizing placement at key levels.
02:08Rejection vs Wick Fill Distinction
Teaches how identical wicks can signal opposite moves, crucial for avoiding false signals.
07:18Wait for Structure Shift
Emphasizes not anticipating reversal patterns; wait for confirmation to avoid premature entries.
17:08Retest & Rejection Entry
Provides a concrete rule for entering breakout patterns that increases win probability.
22:08[00:01] this. I wasn't struggling in trading because the market is hard to read. I was struggling in trading because I didn't understand how to read the every single day. Every single wick, every single candle, every single high,
[00:14] every single low. Whenever the market does a move, sometimes it wants to tell Sometimes it's going to tell you that it's going to get weaker. It's going to get lower or sometimes that it's going to do absolutely nothing at all. And the
[00:26] problem with most beginner traders is that they don't know how to read this they want to sell. They see blue candlesticks and they want to buy. But for experienced traders that they're looking at these exact same candlesticks
[00:39] that beginners traders are confused on what a red or blue candlestick means, a high point, low point, or even if it's a market that's ready to enter. Now, this language that is spoken inside of the markets is what is called price
[00:52] action. Now, I've been executing trading with price action for the last 6 years and it lets me know if a trade setup is strong, if a trade setup is weak, or if a trade setup is not even ready to have a move. And in this video, I'm going to
[01:04] action is and how you can take advantage right into it. So, first things first, let me give you a little bit of context on exactly what price action is. Price action is the way the market
[01:16] communicates just on a nonverbal way. It's almost like if you were to ask me a mathematical equation that I have no idea how to solve it and I go I'm shrugging my shoulders. I'm not verbally communicating it to you, but my
[01:29] body language is meaning that I don't know. But you understand how to read with 99% of traders that they don't understand is that the market communicates very much like body language, but people just aren't
[01:42] educated on how to read that type of language because it's in a nonverbal format. Every single high, every single low, every single open, every single candlestick is communicating something to you. You just have to understand on
[01:55] how to read that. So, price action is how the market communicates on a non-verbal way, no different as if I were to shrug my shoulders on a question with that being said, let's dive right into the charts and let's break down the
[02:08] difference between the first important part to understanding price action. What is a strong candlestick versus what is a weak candlestick? Now, not every single candlestick is identified the same. Now, certain strong candlesticks can form on
[02:22] higher time frames and then weaker candlesticks form on higher time frames. that these candlesticks are being presented. And you need to understand if out of session. So, a couple of these things go in sync. I'll be educating you
[02:36] let's break down the difference between Obviously, at first glance, you would assume that whatever candlestick that is the biggest would be what is called a strong candlestick. Now, yes, that
[02:50] [music] is quite obvious, but not necessarily. Not every big candlestick means that it is a strong candlestick [music] and not every little candlestick means that it's a weak candlestick. It's actually more of market placements and
[03:06] where that movement is actually happening from. So, if you notice this big candlestick, giant enormous bullish candlestick, you would anticipate that right after that move, what would you have? You would have a continuation push
[03:19] big move that you would expect for it to to continue to go to the upside. Well, wrong. What ended up happening after such a big move is it actually had a complete reversal candlestick that came all the way back. So, this big
[03:33] candlestick isn't much of a strong candlestick, as you can tell, because it didn't continue to have that momentum to the upside. But, if you were to look at this candlestick right before it, it's a very small
[03:46] rejection candlestick. This candlestick caused for the following candlestick to have this push to the upside. So, you can't confuse a small candlestick for doesn't mean that it's weak. Just because it's a larger candlestick, it
[04:02] doesn't mean that it's strong. It's where this candlestick is being placed and how can that impact [music] the trade? For example, if you were to have a candlestick to be formed equally just like this one, but this would be formed,
[04:15] for example, right here in the middle of this move, this would be considered what is called weak because it's happening in the middle of the chart. It's not really But, this candlestick, the reason why it could be considered strong is because it
[04:29] is approaching a strong level of support where the last time that we were at this area, we had a massive reaction to the upside. It's our first time approaching here, and we have clearly rejected it. And that is what caused this then big
[04:43] candlestick to have this push to the upside. So, a strong candlestick, what makes it strong is where that candlestick is actually happening. It's almost like if you were to be a big strong bodybuilder amongst a a
[04:58] You're not really that strong at that area. But, if you're a big strong normal people, you stand out. So, it's where you are placed at you would actually stand out and have significance. So, this is essentially a
[05:14] significance. So, this is essentially a big strong bodybuilder in a in an area where whenever it's here, it obviously has a reaction to the upside. So, this is the understanding of price action. For example, as you can tell, we come
[05:26] back into the same area once we were here once again, and we have the exact exact same type of candlestick that happened here, that happened here, happened here once again. So, this [music] is what we call
[05:40] break all those down in just a second. But, this is a strong candlestick because of where the market is placed. and clearly it caused the exact same reaction. It caused this market to have a total push to the upside, very much
[05:53] how it's done one time over here. So, as you can tell, these candlesticks have caused this move right here. This one candlestick caused this exact same move right over here, and it caused the exact same move as well as over here. So, the
[06:09] beauty of understanding what is a strong and a weak candlestick is not falling and a weak candlestick is not falling for what is these momentum traders, right? These people that just look for an impulse move. Now, I enter the trades
[06:23] impulse, and they wait for that momentum, and they just hop in for a scalpers, these ICT guys, these SMC guys, which could work, but they're not catching the real duration of the move because they're just doing stuff
[06:37] impulsively. So, this is what a strong candlestick would look like because we are at a key area, and [music] it is followed by the push. So, this is a strong candlestick. A weak candlestick would be the exact same one, but in the
[06:52] real support or resistance, where there's nothing that's really holding that candlestick up. So, what makes a candlestick strong, to summarize, is that it is placed correctly at an area, and what makes it weak is that it's just
[07:05] in the randomness of the land of the charts. Now, not the actual size will define the strength of the candlestick. Remember that. Moving on to the next subject when it comes to understanding price action,
[07:18] which is the language that we are going to learn how to speak right now, is wicks. Wicks are every single one of these tails that you see to the upside, wicks, you can call them hairs, you can call them lines, you can call them
[07:33] super creative and always give them a different reason or a different purpose. What a wick is, it's basically a trail. The market was a once upon a time at that area could not any longer be at the area and it was pushed to the other
[07:48] side. This price was at one point all the way at that high. So, if I'm going to put my playback here a little bit slower, I'm going to put it at half the speed. When the market opened up the candlestick, the following candlestick,
[08:00] I still going way too fast, but this candlestick opened up and when it opened, it went all the way up here. So, the market opened, it did a move like this, it looked like a full bullish candle, and then what ended up happening
[08:13] after is that sellers came into the market, whatever, decided to push price to the downside, and then it ended up closing like this. So, it's the trail that the market was once upon a time at that area. Now, this could be looked at
[08:28] two different types of ways. It could be looked at as a rejection, or it could be looked at as a wick fill. The two very different things and they can look literally identical. So, what a rejection is is what these would be
[08:42] considered. These wicks over here means that this market was trying to break through this area and it couldn't, so then it went to the upside. This right here is a rejection because clearly the market at one point was a full bearish
[08:55] candlestick like this, tried to break through this area, but it couldn't. So, it rejected and then it went to the upside. Once again, this is the exact same thing but multiple times. The more times you get this, the better. One time
[09:07] here was a red candlestick, it couldn't, then here was an also once again a red candlestick and it couldn't, and it ended up closing to the upside. So, this right here is what would be called a rejection because it is rejecting a
[09:20] support. This could also be considered a rejection at this area here because this right? If I were to draw a little box right here, this is technically a resistance. So, you can get the rejection wick way whether you're at a
[09:35] support or resistance. The price at one significant point once upon a time was a full bullish candlestick here and then guess what? We rejected. This next candlestick was a bullish candle trying to break through and then we closed
[09:48] below and we rejected. And very clearly we continue to have the push to the downside. Same exact thing here. Once upon a time we tried to break through rejected and then the price simply came
[10:00] this right here, you could have easily made money on all three of these positions just by having understanding of support and resistance and price action. Clearly it's rejecting. You just go in the direction of where it's
[10:14] rejecting. Now, this is going to look very similar to what is now called a wick fill. A wick fill is quite the opposite but in the favor of the direction. That is a bit confusing. Don't worry, it's going to
[10:28] make sense right now in just a second. So for example, this candlestick right here is what would be considered a perfect wick fill. And it actually ended up happening perfectly. So what a wick fill is is when you have a candlestick
[10:42] like this that is formed which is technically a rejection of the direction you know how to read price action, you would know it's a wick fill. So as you Technically you can call it bullish because it has this support level and
[10:57] we've clearly reacted from the support level. The following so we have the bullish candlestick that's rejecting along with the the doji rejection. Then you have what is called right here as another rejection candlestick. So
[11:10] this technically people could say, "Oh, it's rejecting the EMA. It's rejecting. I would actually look at this and I'd be like, "That's actually a perfect wick fill." Because what do I do? I go down to then the 4-hour and when I go down to
[11:25] the 4-hour, to me what I'm seeing here is a beautiful retracement on this is a beautiful retracement on this market. And then I'm seeing a inverted patterns right now, which would be a a head and shoulders pattern that we're
[11:38] kind of forming here. What I would see is I would see this as a 4-hour retracement, and on the higher time frame it looks as a rejection. But in reality, it's just a retracement. So, this is
[11:52] this essentially had to happen for the market to create more impulse to continue to go to the upside. So, at once upon a time, yes, this candlestick when it opened, it was a full bullish candlestick. Sellers came in, drove
[12:05] candlestick. Sellers came in, drove price back down, but it's been held up by this massive support that we've clearly reacted and rejected from three times. So, what do you think is stronger? This minor zone here that gave
[12:19] price a little bit of a retracement to the downside, or this massive support that has held price up three times every single times it's come to it? Obviously, the support level that has held price up. So, I'm not going to
[12:32] not take this trade just And this is what happens with majority of traders. because of one candlestick and completely remove an entire top-down analysis and an understanding of the market. Traders get distracted, they get
[12:45] scared, they get confused because they don't know how to react off of one analysis goes out the window because of to read because they don't know how to read price action. So, this one
[12:57] candlestick right here won't completely remove my interest from the trade because I understand on the lower time frame it's creating that retracement give me the perfect entry opportunity to
[13:10] then continue to take this trade to the upside. So, following after that, I candlestick for the 4-hour to create that retracement and have the push up, and then it would fill that wick. So, a wick fill is in the direction
[13:28] a rejection in the direction that we're looking to take. So, that's really just looking to take. So, that's really just the difference between a rejection and a confused and once you understand to read it it's very powerful. Very obvious to
[13:43] we're rejecting it. Very obvious to tell that this is a buy because rejecting. Now that you understand this should be very obvious to anticipate a wick fill favor of the actual trade that you're
[13:55] interested in taking. Now, with that being said I want to move on to our next and most important section which is going to be reversal patterns. So, people overlook these patterns every single day in the market because they
[14:07] just don't understand how to read it and they don't understand how to optimize these patterns. Reversal patterns are not a way of trading and oh, I only trade off of a reversal pattern or only enter a trade off of
[14:19] this. No, a reversal pattern is added to your top down analysis is added to your support or resistance and it's added to your entry point. It's almost like if it were to be an extra seasoning on the actual meal that you're already having.
[14:33] It's not the entire meal but it gives it a little bit more flavor and it makes it more enjoyable. So, patterns make a trade that much stronger. Makes it a bit more clear. Gives it a bit more confluence and direction but it doesn't
[14:47] determine the entirety of the trade. I take plenty of trades without having any patterns and I won't take a trade if it were to only just be a pattern trade. understand how to distinguish one from another. So, there's many different
[15:02] types of patterns. You have reversal patterns and then you have continuation patterns right now. So, one of the main reversal patterns that I trade is what is called the head and shoulders pattern. So, what ends up happening with
[15:15] the head and shoulders pattern is the head and shoulders will have its formation at the high of a market. Right now as you can tell, this market is very much bullish, and you can almost anticipate that this next leg here could
[15:27] create another higher high push to the upside. But, what could end up happening from here is that this will create what is called a reversal pattern, which is a head and shoulders. A head and shoulders pattern happens all the way at the high
[15:40] of a market. This could be on the 1-hour, 2-hour, 4-hour, daily, weekly, monthly, yearly, whatever time frame you want to. But, obviously, the higher the time frame, the stronger it is. And the way of trading these reversal patterns,
[15:52] beautiful parts about reading price action, is never anticipating trading the reversal pattern, and people overlook this so many times. Because
[16:04] point right here. It's like, "Oh, this is going to be that right shoulder that sell off of the right shoulder." [music] Why do you want to sell off of an anticipation? Trading already it has enough anticipation as it is. You're
[16:17] already anticipating it's going to go up or down. Just have the most amount of added reasons to enter a trade that you can possibly have. So, this trade right here, don't take a trade off of anticipating the right shoulder. Have
[16:30] the confirmation that we've indeed shifted the structure, and we've formed the actual head and shoulders pattern. And this is where you would enter the position on when the pattern is formed. The head and shoulders pattern is not
[16:43] formed until we don't shift the structure. This right here was a bullish market. This right here is a higher high, and then this right here is a higher low. This market, as long as we're above these highs and lows, will
[16:56] If you don't know this, hit that like and subscribe button, and go watch my other videos on market structure, highs and lows, because it will break this down to the T, right? But, if you understand that this is a
[17:08] bullish market, the reversal pattern would only be valid once you shift this structure. So, this is the higher low, this is the higher high. Here, we would have shifted the structure, making this a bearish market. And then, what do we
[17:21] also coincidentally have? We also have a what is called a head and shoulders. So, reversal trade from the break of that structure point. You At that point, you can get as creative as you want with what makes you feel the
[17:36] most comfortable with the position, but you only take the pattern once you have the confirmation that the pattern exists. Don't anticipate that the pattern will exist. There's no different in this from a inverse head and
[17:48] shoulders is a market that's hit a low point, and we have created the exact same pattern, but on obviously the opposite side. It's a market that's hit a bottom, and it's reversed, and now it's going to head to the upside.
[18:01] hit a high, it's going to reverse, and now start heading to the downside. You can show you this example right here. This market was heading to the upside, does not get any more clear than this. This market was having a push to the
[18:15] downside, lower high and lower low. Hits the low point, and once this market hits the low point, we then create this head and shoulders pattern. After we create start heading to the upside. After we head to the upside for quite some time,
[18:28] what do we do? Then we create over here another head and shoulders pattern right here, and then we head to the downside. Hit the high point, left, head, right shoulder, and in this area over here, we hit the bottom of the market, left,
[18:41] like playing words with Waldo. As soon as you playing words with Waldo. As soon as you see it, you almost can't unsee it. And it happens every single time at that not every single time. It has a very high
[18:54] probability of happening seven out of 10 times seven out of 10 times that you'll But the most important thing is entering once you have that actual shift of structure. Head and shoulders is by far my favorite reversal pattern that the
[19:08] market can present at any given point. I like to stick to it on the higher time respected, and you get a bigger risk to reward on those positions, which means in turn that you'll make more money. Now, reversal patterns are absolutely
[19:21] amazing, and I trade them all the time. Now, the other favorite type of pattern that price action feeds to you every single every single day in the market, I think more common than the reversal patterns, but not quite as powerful, is
[19:36] the breakout patterns. Breakout, break and retest, consolidation break out, it. There's a thousand names out there for it. But, it's basically where the market is actually going in the direction that it is already intended to
[19:49] go. The reversal pattern is essentially predicting a top or a bottom, and the breakout pattern is doing quite the opposite. You're literally continuing to is headed at that very moment. For example, I have a very simple breakout
[20:05] and I actually entered this trade live. This is a real live trade that I here, as you can tell, it's stuck in this support area. And when it's stuck in this support area, you can anticipate that the market was going to break out
[20:20] of this zone. So, there was two possible trades that I could have taken from this position right here. I could have taken a position either once it broke or once it retested. But, it's in favor of the direction that it's headed to. So, as
[20:33] very much so to break through the support level. Couldn't break once, couldn't break three times, four times, and then on the fifth time that it did break, what happened? I waited for price to come back, retest it, and give me my
[20:49] rejection candlesticks. Now, I entered this position and I took a loss. It's okay. Part of the process. Taking a loss is normal in trading. What do I do? I took the exact same trade once again. The market went back
[21:03] up into this area, broke out of this area once again, and it came back and it retested. I waited for my exact same rejection candlesticks, and then guess what? I entered the position, and then I won this trade. So, if in this trade I
[21:15] won this trade. So, if in this trade I lost 1%, in this trade I made back 6%, I'm net positive 5%. I'm not scared to take a loss, and I'm not scared to presents itself. I'm confident in my trading plan and in my rules and what I
[21:29] trading plan and in my rules and what I do. So, this trade I entered the first break and retest, didn't work out in my favor. I entered in the second break and retest, and it continued to go in my favor. So, I could have entered on the
[21:43] break, which is at this bearish candlestick right here, and I could have had the exact same stop loss, or I could wait for that extra confirmation, which is on the retest, which is what I do, which is what I typically like to do.
[21:55] So, if a market, for whatever reason is consolidating, right? So, if we're just right here, and we're anticipating for us to enter this position on the break and retest, or the breakout, basically trade
[22:08] continuation pattern. You can either enter the position on the breakout as soon as it breaks, or you can wait for a retracement. The retracement is obviously a lot stronger, and you're going to have a lot more confirmation
[22:21] that it can reject this area once again and head to the upside, and you get saved that it's not a fake out and then it continues to go back to the downside. It's impossible to avoid these fake outs, but having this actual
[22:35] break [music] and then retest confirmation, waiting for a rejection probability of winning a position. So, a lot of people make a major mistake, and when they start having the trade make that retracement, they're scared that
[22:49] reaction really fast, and then that they'll miss out on the position entirely, which could be true, but shouldn't determine your execution on to stick to something consistently every single time, so your results can have
[23:04] the exact same recognition as what your rules would be. If you change your rules every single time, so will your results. So, you can either enter the trade right at the breakout, my least favorite. You can enter the trade on the retest with
[23:16] no confirmation, my least favorite out of all of them. Or you can enter on the retest with the rejection confirmation, which is my favorite and my go-to typically on eight out of 10 trades that I were to take with this pattern. So,
[23:28] this is the continuation pattern, the breakout pattern that it goes in favor of the market that you're actually headed in every single week. And the you this opportunity the majority of the times on the lower time frames. So,
[23:42] there's opportunities on day trades, scalp trades of these. You just have to bit less respected. And this is what I break down every single week with my students inside of my community, where I give them the top pairs that I'm trading
[23:56] why they should be interested in entering a reversal pattern compared to a breakout pattern. I let them know why this market has a higher probability of going in one direction compared to the other. Because in a market full of
[24:10] opportunities, it's very easy to get lost. And it's okay to make mistakes. That's why I have classes with my traders where I personally, live in positions to make sure that what they're doing is correct. And if they're
[24:25] actually entering the trade for the reasons that they assumed that they're how to be my student, make sure to DM me the word Sunday Swings. Just click on Talk to one of my team members to see if
[24:38] help you out. But students that join the community, they get access to the live single week with these exact same understandings of price action. And why
[24:50] probability of going in one direction versus the other. Because great, but it all comes down to price action and what these candlesticks are the market has been having lately with fundamentals, wars, presidents being
[25:05] year you're watching this video in, but very recently, the fundamentals have been going crazy, and price action has shifted, but the core foundations of it know more about it, DM me the word Sunday Swings. If you like this video,
[25:19] hit that like and subscribe button, and I'll see you guys in the next video.
⚡ Saved you 0h 25m reading this? Transcribe any YouTube video for free — no signup needed.