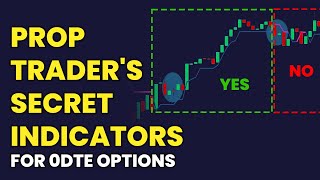

Secret Indicators for Huge Market Moves
43sPromises hidden indicators for explosive market moves, appealing to traders seeking an edge.
▶ Play Clip"The title promises secret momentum indicators for zero DTE success, and the video delivers exactly that with clear examples and strategies."
In this video, Garrett Dryan and Mike Bella Fury explain how to use three key indicators—the Tick index, Bollinger Band squeeze, and ATR trailing stop—to identify high-probability momentum setups and trade them with zero DTE options strategies. They demonstrate the approach with real examples on QQQ and NVDA, showing how to enter, manage, and exit trades for maximum profit with limited capital.
The setup uses three variables: 1) Tick index to gauge immediate buying/selling pressure, 2) Bollinger Band squeeze to identify volatility contraction, and 3) ATR trailing stop to manage trade exit.
When the Bollinger Bands contract inside the Keltner Channel, it signals maximum volatility contraction, indicating a potential explosive move. This does not predict direction but suggests energy buildup.
A Tick holding above zero indicates strong buying pressure; below zero indicates selling pressure. Combined with a squeeze, it confirms potential for a trending move with follow-through.
The ATR trailing stop (3 periods, 1 ATR) trails below price on uptrends or above on downtrends. It helps stay in trades until momentum ends, crucial for zero DTE options to avoid time decay.
With Tick below zero and a squeeze, price broke down. Entry near 354.85, bought 15 puts at 62 cents ($930 cost). By close at 350.32, puts were worth $2.71 each, yielding $3,135 profit (over 3x return).
Bought 15 calls at 367 for 60 cents ($900). At 12:30, sold 15 calls at 368 for 77 cents, creating a risk-free vertical spread. By close at 367.71, profit was $1,410 (over 50% return) with no chance of loss after 12:30.
Similar setup on NVDA: squeeze consolidation, ATR hold, and breakout higher. The tick confirmed strong market buying pressure, making the trade more reliable.
Consolidation right at the open, shorting the break with momentum lower. Great risk/reward with stop above the high.
Combining market indicators like Tick, Bollinger Band squeeze, and ATR trailing stop with zero DTE options strategies allows traders with modest accounts to profit from momentum moves with limited risk. The key is to align indicators with the market environment and use options to express directional views efficiently.
What are the three indicators used in the momentum setup?
Tick index, Bollinger Band squeeze, and ATR trailing stop.
02:09
What does a Bollinger Band squeeze indicate?
Maximum volatility contraction, suggesting a potential explosive move is likely.
03:28
How does the Tick index confirm trend direction?
Tick holding above zero indicates strong buying pressure; below zero indicates selling pressure.
04:57
What are the settings for the ATR trailing stop used in this video?
3 periods and 1 ATR multiplier.
13:34
In the first QQQ example, what was the cost of buying 15 puts and what was the final profit?
Cost: $930 (15 puts at 62 cents each). Profit: $3,135 (sold at $2.71 each).
12:06
How did the traders make the long call trade risk-free in the second example?
They sold a higher strike call (368) after buying the 367 call, creating a vertical spread that generated positive cash flow.
16:46
What is the purpose of using the ATR trailing stop for zero DTE options?
To exit the trade as soon as momentum ends, avoiding time decay from holding sideways.
09:59
Why is the Tick index useful for individual stock trades like NVDA?
Because NVDA is a market stock that moves with the overall market, so the Tick confirms buying/selling pressure in the broader market.
20:22
What delta were the options chosen in the examples?
Approximately 30 delta (or nearest available).
10:54
What is the key takeaway from the video for traders with modest accounts?
Combining market indicators with zero DTE options allows participation in big moves with limited capital and reduced risk.
21:59
Three-Indicator Momentum Setup
Core framework combining Tick, Bollinger Band squeeze, and ATR trailing stop for timing momentum trades.
02:09Bollinger Band Squeeze Definition
Clear explanation of how to identify volatility contraction and anticipate a breakout.
03:28Short Trade Example with 3x Return
Demonstrates real application of the setup yielding over 300% profit in a single day.
08:35Risk-Free Vertical Spread Technique
Shows how to eliminate risk by selling a higher strike call, turning a trade into positive cash flow.
16:04Empowering Small Account Traders
Highlights how options allow traders with limited capital to participate in high-priced equities.
21:59[00:02] gett dryan shares the secret indicators he uses to determine if a huge move is about to happen in the market and then we show you how to crush the setup using zero DTE options strategies I'm Mike Bella Fury and we're one of the top
[00:17] proprietary trading firms located in New York City since 2005 and proud to develop numer 7 and even eighth figure per year Traders watch take notes and learn from professional Traders on our proprietary trading desk so you can grow
[00:32] freudberg and I'm the head Trader of SB capitals options trading desk here in Manhattan and we're in contact with Traders all over the world who are looking for ways to spot how to know when a particular trading day is setting
[00:46] up to be particularly volatile giving rise to momentum trading opportunity and at the same time some of the folks who follow us don't necessarily have large trading accounts so they'd also like to find ways to take advantage of those
[01:01] momentum setups in a way that doesn't involve a huge amount of capital and so today we're going to be covering that exact topic how to take advantage of exact topic how to take advantage of momentum setups using options so this is
[01:14] the fourth video in the YouTube series that Garrett dryan and I have worked on together to share with you how trading indicators can be used to formulate options trades particularly for Traders who may not have tons of capital but
[01:28] really want to participate in Big Market moves now before we get into this more deeply if you're absolutely brand new to options trading and you don't know much about options and how they work we've created a video for you to understand
[01:41] options Basics and if you click the video appearing on your screen right now it will lay the groundwork for you to understand the option strategies we're Then when you're finished you can come back and watch the rest of the video
[01:55] okay so with that Garrett uh can you share with us how use spot when the market is setting up for a potentially explosive move here's a momentum setup and we'll use three variables in the setup they're all
[02:09] indicators first one is the tick right and this is how we gauge the immediate buying or selling pressure of the market and we talked about this in the previous videos in this series so I'm sure we can link these other videos down below if
[02:23] you've missed them to get into more detail about the tick okay that's number one number two is we're going to look for a Ballinger band squeeze and we'll get into that in a second we'll describe what that is and then number three is
[02:36] we'll use an ATR trailing stop which is something I use all the time uh in my alos mostly but even discretionarily and it's a great way to stay in a trade it's also a great way to not overstay your welcome so those are the three things
[02:49] we're going to look at for this setup and yeah I mean because this is a momentum setup because this is a setup that helps us time the market really well and it also helps us get out as
[03:03] well and it also helps us get out as soon as momentum stops it is great for trading zero DTE options this isn't the only thing you can do with it you can do it with stock you can trade it with other kinds of
[03:15] options but if you are trading zero DTE options and if you're actually buying calls or buying puts it can be a great way to do it because it's all about momentum and all about timing all right so here's the Binger band squeeze so
[03:28] let's let's understand what this is first and on this chart you can see that there's a Kelner Channel and there's a Binger band okay and what happens is Binger band okay and what happens is these bands contract when volatility
[03:43] contracts so when price and you can see here on this chart when price starts to consolidate and get really tight these bands start to contract and get closer to price so when the Ballinger band which is usually the outside
[03:58] band when when it comes inside the Kelner Channel That's when technically we're in a Ballinger band squeeze and that indicates that volatility is in Max
[04:11] contraction and so that's a signal that can tell us that something on the time frame that we're trading has been consolidating and tightening up long enough to build up enough energy for us to expect a big move and it doesn't mean
[04:26] mean it's going to go lower right we don't even know which direction this is necessarily going to go and it also doesn't mean of course that there's going to be a big move it just means that it is likely to have the energy to
[04:41] do so okay so this is why we're going to combine this with other things so if we go to the next slide we can check out The Tick Okay so we've covered this as I said and the tick is down at the bottom and on this chart I've just highlighted
[04:57] instances where the tick has been holding above zero or holding below zero really cleanly and this is a multi-day chart and the tick can do this for an entire day or it can do this for periods of a day but if it does it for any
[05:14] extended period of time that usually signifies that there's a tremendous amount of buying pressure if it's holding above zero or selling pressure if it's holding below zero because that means that most of the stocks on the
[05:27] exchange are ticking higher right if if you can't even get the tick say below zero that means that for an extended period of time the tick the stocks that are ticking higher are just outweighing the stocks that are ticking lower so
[05:41] what we're going to look for in this case is a situation where we have a tick tremendously weak so holding above zero going to look for that Ballinger band squeeze at the same time to let us know
[05:57] that energy has been building up okay and the reason why these work well together is the tick is kind of letting us know that there's a potential for Trend and a potential for follow through in that direction because of the intense
[06:10] buying or selling pressure and the Ballinger band squeeze is just letting us know that there's a potential for this energy release right for a big move we don't want to be getting in in the middle of the move and kind of risk a
[06:24] the end of the move we kind of want to get in right when the move starts especially for trading zero DT options um and then we want to be able to get right out when the move ends so that brings us to our third indicator and
[06:38] that's the ATR trailing stop and like I said I use this all the time in alos just because it's a great way to manage a trade for me I actually like this to stay in trades because a lot of the times when we get a really big Trend
[06:53] further than we think and it's nice to have a systematic way sometimes to get out of a trade because often that means that we're actually going to stay in until the trend terminates right and it's so easy to to kind of trade your
[07:08] right because we kind of want to take profits but this this helps me personally stay in these really big trades and you can do this on any time chart and again one thing to keep in mind with all
[07:23] this stuff is this is an indicator setup okay so with any kind of IND indicator setup we're going to really care about the market environment that we're trading right we're not just going to look at these like a magical Sim signal
[07:38] and just kind of like take every long take every short expect it to work right like nothing works that way so just as a everything that we've taught in the previous three videos in this series but
[07:52] when we know that we're in a market environment that's very bullish or very bearish right we might be say in a breakout day where we expect to close at the highs okay you might be trading a stock that just broke out
[08:07] during a very strong Market day and of course we can flip this to the downside right so we're using these indicators as tools to help us time and manage a trade
[08:19] that we already think has a reason to continue close at the highs close at the that momentum so here's our first example right and we're trading the where that first circle is that would be where the entry is because down below
[08:35] you can see the dots that are highlighted in red signify that we're in highlighted in red signify that we're in a Ballinger band squeeze and you can see that the tick is holding below zero very cleanly so we actually have a moment
[08:50] here where price is going sideways we can assess the situation and we can see that selling pressure so it gives us that extra conviction that extra that extra conviction that extra information to say that if we short this
[09:03] break right and that's what I would be doing I would be shorting the break or as price finally starts to hold below that ATR trailing stop you can start to that ATR trailing stop you can start to look for that short signal that price
[09:16] should follow through to the downside and then once that happens and we and price moves away from the consolidation you can see that ATR trailing stop will just kind of fall right behind and so as the as the Market sells off and you're
[09:30] short you can look at that ATR trailing stop and just feel a lot better that you know I'm not going to get out of this thing unless price closes above that ATR trailing stop and so you can see how your risk is kind of being reduced the
[09:45] lower the price goes and then finally um we kind of capitulate a little bit and get back above the ATR trailing stop and then that gets us out and the reason I really like this especially for zero DT options is because I don't want to sit
[09:59] there and let things go sideways if I'm long puts in this situation because of long puts in this situation because of course the time Decay is unbelievable right the the day is going to end at some point and we can't just wait around
[10:14] another leg right and if there is another leg maybe we get another one of these setups and we can get back in but I want to be out as soon as the trend ends all right so Garrett at this point I'd like to jump in because uh I used
[10:28] the back testing software that guys own our options DES use to model how certain trades would have performed in certain historical situations and so I pulled up the price chart that morning and it turns out that having been selling off
[10:41] all morning by 11 the stock was trading at at 35485 as you can see and so let's just say we got in at 11 and we went ahead and we looked at the zero DTE options
[10:54] chain and found the put option nearest to 30 Deltas which was the 353 put right below where the market was trading at that point and while we don't have the time to cover exactly how you calculate an options Delta suffice to say that an
[11:10] options Delta is an estimate of how much the options price will move compared to a onepoint move in the underlying asset which in this case is the q's and so which in this case is the q's and so let's say the trader decides to buy 15
[11:23] let's say the trader decides to buy 15 of those options at a price of 62 cents and so for this put option to have value by the end of the day uh the cues will need to get below 353 before the day's out and so we'll need to push a good bit
[11:38] down for this trade to work which is why we would choose this strategy on a day where we expect there to be a significant downward pressure on the qes and just to be clear here when we buy a put option we're buying the right to
[11:52] put option we're buying the right to sell 100 Q shares at a price of 353 regardless of how low the Market's Trading that day and so you multiply that price by 100 and we bought 15 of them so when you do the math this cost
[12:06] us $930 okay so let's move to the end of closed at 25032 pushing down further which of course is what Garrett's whole premise was for the day and the result is that
[12:21] the 353 puts closed at a price of 271 which should make sense to you because the strike price of the put options 353 is just about the amount above where the stock closed meaning that the right to sell shares for 353 when they're trading
[12:37] 35032 should be around that price because that's what that right is worth and so what that means is that we can sell those puts at the close for 271
[12:49] which if you follow the calculation means that we can sell them for 3,135 more than tripling of our initial Capital At Risk in the trade in the first first place and so even though we didn't get out at that earlier point
[13:03] that you mentioned Garrett uh we still made an amazing trade even staying in allowing all that time premium to Decay so okay so go ahead now with your next example all right great so here is another QQQ example to the long side
[13:18] this time and I just want to take a second to talk about these indicators so first the trailing stop just notice how it trails along the bottoms of those candles so the way it's doing that is that it's hanging a trailing stop one
[13:34] that it's hanging a trailing stop one ATR below the 5 minute close and it's using three periods so three five minute bars to calculate that ATR so when you go into your platform and you have a period and an ATR setting you want to
[13:50] pick for this particular setting three periods in one ATR okay and I use ation but that's the setting that we're using here for this particular setup and
[14:03] then also just notice the squeeze down at the bottom so this these are just dots right and they light up red when we're in the squeeze as we said before if you bring this up on your platform
[14:15] often there's going to be a histogram I just remove that okay and uh there's someone named John Carter over at simpler trading who's a great resource for the squeeze uh he uses it all the time he has a lot of setups around that
[14:30] um so if you want to learn more about it that's where I have learned a lot about that's where I have learned a lot about it in the past um but just just notice it in the past um but just just notice how the uh the red dots just show up as
[14:43] soon as price like starts to consolidate long enough in order to build that energy so that's what we're looking for in this example so in a case like this where we have a wick High way above the consolidation I'm not going to buy the
[14:56] break like that's too high for me so I'm going to get in earlier in a situation like this so I'm going to wait for price to start holding that ATR trailing stop and then I might buy the break of that mini consolidation before the high okay
[15:10] so Garrett Let's uh see how we could have taken the bullish momentum on this day and traded it using options so just as we have in the past examples let's take a look at where the cues were trading at at 11:00 a.m. that day and we
[15:24] can see that the qes were trading at 36626 and so in parallel to what we did on the put side the most normal thing to do would be to express a bullish trade
[15:36] with a long call option just like we did expressing you know the bearish trade with a put option uh on the previous example and so we pull up an options chain expiring that same day November 3rd and we find the closest strike
[15:50] priced to again 30 Deltas which in this case was the 38 Delta and that's going to happen sometimes you're going to get a Delta that's not super close to 30 so you just sort of have to pick one and we went ahead and we bought 15 of those for
[16:04] 60 and so that cost us $900 now in this case we want to show you that while you could simply you know allow the option to expire at the end of the day untouched there's a maneuver that you can make that you may want to
[16:17] consider as a way to pull risk out of the trade that I think you're going to find very interesting and Garrett uses all the time so let's move to 12:30 that day an hour and a half later and as you can see the qes had continued to rally
[16:32] and so let's take a look at the pricing of the options chain at 1230 and as you of the options chain at 1230 and as you can see the calls up at 368 the strike right above the one we bought those were actually selling for 77 cents and so we
[16:46] go ahead and sell 15 of those forming what options Traders referred to as a what options Traders referred to as a long call vertical spread now why do we do that well to begin to answer your question let's take a look at the cash
[16:59] flow of the trade now because we sold those 15368 we brought and we brought in 1155 for those but then remember we bought the calls for 900 well that's
[17:12] means that we're literally risk-free on the trade we've pulled all the risk out of the trade and why do I say that well think about it at why do I say that well think about it at any closing price below 367 both the
[17:26] long calls at 367 and the short calls that we sold at 368 expire worthless right there's obviously no value to a call that expires above the closing price of the stock because no one's going to exercise their right to buy a
[17:39] stock at a higher price than it's worth in the open market and so what that originally bought expire absolutely worthless the 367 even if the market closes below 367 we will still make at least $255 on the trade why because the
[17:57] trade turned positive cash flow once we sold those 368 calls and so the only risk of the original trade which is that the 367 calls uh would expire worthless
[18:10] because the cues would close below 367 that risk has been completely pulled out of the trade by selling the 368 and that's because there's no lower price than zero which is what the 367 cost
[18:24] would be worth at a closing price below 367 and so even at a price of zero for the 367 we still make $255 on the trade and that's because we banked that as soon as we sold those 368 and so now let's move
[18:42] to the end of the day and as you can see the q's closed at 36771 having sold off a bit from its original highs in the afternoon but still up for the day nicely and so now we're in a position to assign a final
[18:56] value to the options comprising this long call vertical spread and so first of all the stock closed at 36771 and so with calls you value them by taking the closing price of the stock and subtracting out the strike price of
[19:10] the call because this is a right to buy shares at 367 when they're trading higher than that so by subtracting them you get the pure value of the option itself which is 71 cents because you now have the right to buy each of the 100
[19:25] shares for 71 cents greater than trading in the open market so the final value of in the open market so the final value of the 367 calls times 100 shares times 15 call options is equal to 1155 as you can
[19:39] see from the calculation and the 368 of course expire worthless because those expired above the closing price of the cues so no one is obviously going to exercise those and then don't forget we collect a net of 255 from the
[19:54] combination of buying the 367 calls and selling the 368 calls at a higher price than we bought the 367 resulting in a total profit of 1410 for the trade in
[20:07] five hours being a reward of more than 50% of our risk in the process and remember that that trade had no chance of becoming a loss after 12:30 because we had turned positive cash flow at that point in the trade here's an example in
[20:22] Nvidia so this is a perfect case where we can actually do this on an individual name especially a market name right we want something that's somewhat tied to the market because we're using the tick right and the tick is Market bread right
[20:36] so this is a Market stock it's typically going to move somewhat with the market it might be a lot stronger it might be a lot weaker especially on a breakout or something like that which which might make this setup even better uh but we
[20:49] make this setup even better uh but we can still use the tick to make sure that there's a lot of buying pressure on this day in the overall Market Okay so so we get the same same kind of pattern we get that squeezed consolidation it holds the
[21:02] ATR trailing stop it takes out the high and we get an up move right and and remember we want to use this on situations where we have technical breakouts we have news catalysts we have days where the internals are extremely
[21:16] strong extremely weak we have the offensive sectors leading um or lagging right we want things to be aligned in order for us to kind of zoom in and then we're going to play the momentum so let's go to the one final slide and this
[21:31] let's go to the one final slide and this is a short setup again in the cues and we get that consolidation right off the open so I actually really like it like it when this happens because you get a great risk reward you get a great stop
[21:44] against the high and you can short that break and just ride the momentum lower okay thanks Garrett and what I'd like you to take away from today's video and really this series of four videos that we've now completed is that combining
[21:59] the knowledge of market indicators like Garrett has so generously shared with you and expressing the directions suggested by those indicators through option strategies can be really an incredibly profitable and Powerful
[22:13] practice particularly for Traders with modest size accounts who might not think that they can get involved in trading the shares of say high-priced equities but definitely can afford to be involved in trading options on those equities
[22:26] which are typically Al priced much much lower than the equities themselves and potentially make very profitable trades with much less risk than might have been imagined that's why collaborations within a proprietary trading firm are so
[22:42] powerful Traders bringing different skill sets to the table and combining their knowledge can result in very powerful positive outcomes as you saw from these videos now if you'd like to learn three more option strategies that
[22:56] our prot Traders use in including the unique options trick that allows you to make money while you wait to buy stocks or ETFs at the price you want and the options income strategy that allows you to make consistent money whether the
[23:11] to make consistent money whether the market goes up or down or sideways and how to make money on a stock or index trade even if you're wrong on the direction then click the link that's appearing right now at the top right
[23:24] hand corner of your screen that will open up the free work shop registration page in a new window so don't worry you won't lose this video or you can register directly for free at options.com
⚡ Saved you 0h 23m reading this? Transcribe any YouTube video for free — no signup needed.