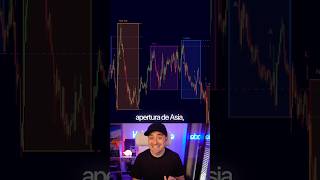

How to Create a Session Breakout Indicator in 2 Minutes
44sThe promise of creating a trading indicator in 2 minutes without coding knowledge is highly engaging for traders and tech enthusiasts.
▶ Play Clip"Delivers a practical demo but oversells the '2 minutes' claim and lacks depth on reliability."
Snapshot 2026-11-18
Every observation TubeSum recorded, plotted as measured.
The vertical axis starts at 5.6K, not zero, so later observations stay readable.
Based on 8 observations · last observed Nov 18, 2026 · solid lines connect consecutive measurements (≤2 days apart); dashed lines span days TubeSum did not measure. · vertical axis focused on the observed range (starts at 5.6K)
Exact daily observations; gaps mean no observation was taken that day.
| Date | Views | Avg views / hour | Channel median |
|---|---|---|---|
| 2026-11-18 | 5,956 | 12.0 | — |
| 2026-11-17 | 5,906 | 12.5 | — |
| 2026-11-16 | 5,868 | 12.7 | — |
| 2026-11-15 | 5,816 | 13.4 | — |
| 2026-11-14 | 5,774 | 14.4 | — |
| 2026-11-13 | 5,747 | 15.2 | — |
| 2026-11-12 | 5,714 | 16.2 | — |
| 2026-11-10 | 5,650 | 18.5 | — |
Audience reaction — separate from the performance metrics above.