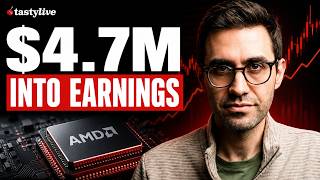

AMD's Biggest Options Move in 10 Earnings Reports
60sHigh-stakes earnings bet with record implied move attracts viewers interested in market speculation.
▶ Play Clip"The title accurately describes the trade, but the video is more of an analysis than a revelation, so it's solid but not exceptional."
This video analyzes unusual options activity in AMD ahead of its earnings report, focusing on two significant call trades. It examines the implied move, historical performance, and institutional support to assess the potential outcome.
AMD is expected to report EPS of $1.61 on revenue of $11.3 billion, a 47% year-over-year increase. Options are pricing an 8.58% move, the largest for AMD in the past 10 reports.
A $4.33 million trade was placed on August 7th $467.50 calls, 4 days to expiration, with 128% implied volatility. 97% of the trade was on the ask side, indicating aggressive buying.
A second trade of $378,000 was placed on August 10th $522.50 calls, 7 days to expiration, 13% out of the money, with 103% implied volatility. This is a breakout bet requiring a real upside surprise.
AMD's average 1-day move over the last 10 reports was 7.9%, just below the implied move. The stock closed higher only 4 times the next day and 3 times a week later.
In Q1 2026, AMD rose 18.6% the next day after pricing a 7.6% move. In contrast, Q4 2025 saw a 17.3% drop. The recent memory is the runaway gap.
The street's average price target is $577, implying 25% upside. Recent target moves include Susquehanna at $500, Mizuho at $625, and Baird at $1250.
What is the implied move for AMD's earnings, as priced by the options market?
8.58%
00:37
How much premium was spent on the main AMD call trade?
$4.33 million
01:19
How many days to expiration did the main AMD call trade have?
4 days
01:19
What was the implied volatility at the time the main AMD call trade was executed?
128%
01:32
What is AMD's average 1-day move over the last 10 earnings reports?
7.9%
03:49
How many times did AMD close higher the day after earnings in the last 10 reports?
4 out of 10 times
04:01
How much did AMD rise the day after its Q1 2026 earnings report?
18.6%
04:32
What is the street's average price target for AMD, implying roughly 25% upside?
$577
05:58
Largest Implied Move for AMD
The 8.58% implied move is the largest across AMD's past 10 reports, indicating high market uncertainty.
00:37Aggressive Earnings Trade
The $4.33 million trade on short-dated calls shows a clear strategy for betting on an immediate post-earnings move.
01:19Historical Fade Pattern
AMD's mixed history of closing higher after earnings suggests a potential fade, which is crucial for risk assessment.
03:49Recent Runaway Gap
The Q1 2026 18.6% surge is the memory traders are working with, influencing current positioning.
04:32Institutional Support
The average price target of $577 provides a bullish backdrop, but the reaction vs. expectation is key.
05:58[00:06] into earnings. This is signal versus noise where we take a look at unusual activity on the options tape and ask the question, what's actually going on and they're coming up with their earnings report right around the corner.
[00:21] Uh the historical setup is not as clean as maybe the flow looks. So yes, 4th. The street's looking for a roughly a $1.61 in EPS on 11.3 in revenue, which is an increase of 47% year over year. Options are pricing an 8.58%
[00:37] move in either direction, which is the largest move priced across any of AMD's prior past 10 reports. And I think that's the first thing we really need to companies that have reported this earnings cycle, if it's the
[00:49] semiconductor semi caps, hyper scalers, a lot of these tech companies have seen the actual earnings move go in excess of what the market was implying. And so AMD has seen the market kind of charge up here ahead of its report. A few weeks
[01:01] about a 6% move and now we're going closer to 8 and 1/2% here. So that is know here. But now let's go to the trades which were placed this morning, market opened when the stock was trading closer to $462 a share.
[01:19] The main AMD trade placed this morning was the August 7th 467 and 1/2 calls, 4 days to expiration, just about 1 to 2% out of the money at the time the trade was executed. That's 4.33 million in premium spent. Implied volatility was
[01:32] about 128% at the time and 97% of the trade was pretty aggressive. It's definitely an earnings trade here, right? Short dated, close to the money, almost entirely ask side. The buyer was paying for AMD to
[01:45] move immediately after the print. With just 4 days to go and 128% implied fast. And already today, with the uh on our screens here at the time of this recording. The market's already
[01:58] is looking like it may work out. So, it needs to do more though, right? A mild levels, it could send this trade scuppered really quickly. The second trade though is a little bit different after all. We need to see uh, more of a
[02:14] we're trading at 49 right now, we've already jumped over the strike for that shorter dated call, the second one is still a little bit more work to do. Um, the second trade here, August 10th, 522 and a half call placed, 7 days to
[02:28] expiration, 13% out of the money at the time that it was executed. The premium spent was much smaller, about $378,000, but implied volatility still 103% and 89% executed on the ask side. So, we'll call
[02:42] this the breakout trade, not just bumping up after earnings with a little bit of continuation, but ultimately uh, repricing event that the market's going to feel a little bit more certain about AMD on the other side of this. Uh, when
[02:54] you look at the trade here up at the 522s though, we're talking about almost no open interest in this position when the trade is executed. Of course, it's a of the size trades that we've covered around here in Signal vs. Noise, but it
[03:09] certainly a bet that needs a real upside surprise. So, not just a good quarter, right? How much of this earning season has been defined by great earnings numbers and stocks falling thereafter.
[03:21] going to come around the corner, it's the follow-through. So, the tape map and trade map is pretty clear, right? 467 and a half is the serious earnings bet. The 522 and a half here, just 7 days out to go, is a little bit more upside
[03:35] If we're looking at history though, and we did say at the start of this recording that maybe the historical map isn't as clean as the options flow looks. The last 10 earnings reports are mixed at best. AMD's average 1-day move
[03:49] over that window over the last 10 reports was about 7.9% which is just reports was about 7.9% which is just below the 8.58% implied move that we're looking at today. The stock closed higher only four of the last 10 times
[04:01] the next day. One week later it was only higher three of the last 10. So that could be a warning sign here. AMD can move. It usually does move, but it winner because the guidance in the cyclical nature of the semiconductor and
[04:18] traders and investors have a little bit of a difficult time buying what the here. However, new world. Because one of the times where it didn't
[04:32] do those things was the most recent report in Q1. Q1 2026 priced a 7.6% report in Q1. Q1 2026 priced a 7.6% move. AMD rose 18.6% the next day and a one week later on. That is kind of the memory that traders
[04:48] are working with right now. Stuff that happened in 2024 or early 2025, it's Uh most traders here are going to remember the most recent runaway gap. They're not going to be thinking about the 10 earnings trade history. So
[05:03] yeah, before that Q4 25 was ugly. Options were looking at 6.9% the stock dropped 17.3% the next day and it was down 11.8% over the course of the next down 11.8% over the course of the next week. Q3 25 uh up 2.15% on day one, but
[05:16] down 5% a week later. Q2 25 dropped 6.4% the next day. So the tape is paying for the recent upside reaction, right? While the longer record says that AMD tends to fade around these things. But that's what makes these trades perhaps
[05:30] actionable here. If you're the 467 and a half call buyer right now, you need AMD move, which thankfully today it's already doing. If the stock gaps higher, inside the expected range, the option could struggle a little bit here. So
[05:44] getting to 500 or so would be great. Uh this 4-day clock is ultimately the is a trade that you may be in yourself at home, keep that in mind. The clock we do see that you have plenty of institutional support. The street is
[05:58] Average price target around 577, which implies roughly 25% upside from here. Recent target moves have been bullish with Susquehanna at 500, Mizuho at 625, Goldman, Jefferies at 640. Baird has come in with a high price target of
[06:13] 1250. So, plenty of institutional cover for the bulls. The earnings though are about the reaction versus the expectation. The company can still have produce a bad event if the options market is pricing in the absolute wrong
[06:27] thing here. So, let's keep an eye on AMD this week. We have earnings coming up on watching this video, you're probably seeing it on this Tuesday, so they're coming up later on today. Otherwise, we'll see you tomorrow. I wonder what
[06:39] though. Is the signal the fact that traders are piling back in to the chip from the hyperscalers as their capex numbers continue to go up, or is this getting lucky with the market moving in their direction before those numbers
[06:55] thoughts below. This has been another episode of Signal vs. Noise. You're watching tastytrade like and subscribe for more videos.




⚡ Saved you 0h 07m reading this? Transcribe any YouTube video for free — no signup needed.