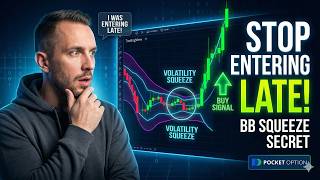

The Squeeze Setup That Predicts Big Moves
60sExplains a visually compelling concept (Bollinger Bands inside Keltner Channel) that promises a clear edge, appealing to traders' desire for a simple yet powerful strategy.
▶ Play Clip"Delivers exactly what the title promises — a clear, actionable strategy with real chart examples, though the 'stop entering late' hook is only lightly addressed."
This video presents a trading strategy that combines Bollinger Bands and the Keltner Channel to identify low-volatility 'squeeze' phases and time breakouts. The presenter demonstrates the setup on Pocket Option with specific indicator settings and walks through live chart examples, including a failed trade to illustrate the importance of breakout quality.
Bollinger Bands: period 20, deviation 2. Keltner Channel: multiplier 3. Time frame: 1-minute candles, 3-minute expiry.
When Bollinger Bands move completely inside the Keltner Channel, volatility is low and the market is in a 'squeeze' phase. No trades should be taken during this phase.
The actual signal occurs when price breaks out and Bollinger Bands expand outside the Keltner Channel. A strong red candle closing below both lower bands is a sell signal; a strong green candle closing above both upper bands is a buy signal.
Skip trades if the breakout candle is small or has a long wick. Always wait for the candle to close completely to avoid fake breakouts.
In a sell example, after a squeeze, a strong red candle closed below both bands, leading to a profitable trade. The market moved in steps with minor pullbacks, which is normal.
In a buy example, a strong green candle closed above both upper bands after a squeeze, resulting in a profitable trade with minimal pullbacks.
A trade failed because the breakout candle had an upper wick (rejection), indicating sellers were active. The market reversed, resulting in a loss. This shows the importance of breakout quality.
What are the recommended Bollinger Bands settings?
Period 20, deviation 2
00:53
What is the Keltner Channel multiplier setting?
Multiplier 3
00:53
What time frame and expiry are used in the strategy?
1-minute candle time frame with a 3-minute expiry
00:53
What defines a 'squeeze' in this strategy?
When the Bollinger Bands come completely inside the Keltner Channel
01:35
What should you do during the squeeze phase?
Do not take any trades during the squeeze phase
01:50
What is the sell signal in this strategy?
A strong red candle closing below both the lower Bollinger Band and the lower Keltner Channel
02:30
What is the buy signal in this strategy?
A strong green candle closing above both the upper Bollinger Band and the upper Keltner Channel
02:30
What should you do if the breakout candle is small or has a long wick?
Skip it; look for a strong, full-bodied candle
02:42
Why is it important to wait for the candle to close?
Wait for the candle to close completely to avoid fake breakouts
02:55
What detail in the breakout candle caused the failed trade?
Rejection from the top (upper wick) indicating sellers are active
07:14
Squeeze Definition
Clearly defines the core setup condition using two indicators, making it actionable for beginners.
01:35No-Trade Rule During Squeeze
Emphasizes patience and avoiding premature entries, a common mistake for new traders.
01:50Breakout Confirmation
Provides specific, rule-based entry signals (strong candle closing beyond both bands) that remove guesswork.
02:30Rejection as a Failure Signal
Highlights a subtle but critical detail (upper wick) that can invalidate an otherwise perfect setup, improving trade quality.
07:14[00:01] wrong time, not because they don't have a strategy, but because they don't understand when the market is about to move. In today's video, I'm going to show you a very simple but powerful concept using Bollinger Bands and the
[00:14] Keltner Channel together. This strategy helps you identify the completely quiet and when it's about to make a strong move. And trust me, this one concept alone can completely change the way you look at charts. So, make
[00:28] sure you watch this video till the end because I'll also show you the exact entry timing, which is where most traders usually make mistakes. Before we begin, just a quick reminder, trading involves risk and past performance does
[00:41] not guarantee future results. Always practice on a demo account before trading with real money. Now, before we move ahead, let me quickly show you the exact settings I'm using so you can apply this strategy properly on your
[00:53] On Pocket Option, I keep my Bollinger Bands at period 20 with a deviation of two. For the Keltner Channel, I set the multiplier to three and I'm using a 1-minute candle time frame with a 3-minute expiry. Once your setup is
[01:07] ready, let's understand how this actually works. First, understand one very important thing. The market doesn't move randomly all the time. It moves in phases. Sometimes the market is active and moving fast and sometimes it becomes
[01:21] very slow and quiet. And this strategy is all about identifying that quiet phase just before a strong move begins. Now, when you apply both indicators on something very interesting. There are moments when the Bollinger Bands come
[01:35] completely inside the Keltner Channel. This is what we call a squeeze. At this point, volatility is very low. Price is not moving much. It's like the market is just waiting, preparing for something. And here's a very important rule. During
[01:50] this squeeze phase, you should not take any trades because at that moment, the Now, think of it like a spring being compressed. The more it gets compressed, the stronger the move will be when it finally releases. And that release is
[02:05] exactly what we are waiting for. So, what is the actual signal? The real signal comes when the price breaks out and the Bollinger Bands start expanding outside the Keltner Channel again. This tells us that the market is no longer
[02:17] quiet. It has started moving with momentum. Now, this is the main moment you need to focus on. If you see a strong red candle closing below both the lower Bollinger Band and the lower Keltner Channel, that becomes your sell
[02:30] signal. And if you see a strong green candle closing above both the upper Bollinger Band and the upper Keltner Channel, that becomes your buy signal. But don't rush into the trade. If the breakout candle is small or has a long
[02:42] wick, it's better to skip it. You should always look for a strong, full-bodied candle for proper confirmation. Also, make sure you wait for the candle to close completely because many times the market gives fake breakouts before the
[02:55] candle closes. This strategy is not about taking multiple trades. It's about waiting patiently for the right setup. To help you understand this even better, I've also created a free PDF guide where I've explained the setup and
[03:09] confirmation rules step by step. You can download it using the link in the video description. Now, let's move to the chart and look at some real examples of how this strategy works in live market conditions. So here, if you look closely
[03:22] at the chart, you can see that the market was already in a squeeze phase earlier. The Bollinger Bands were inside the Keltner Channel, which means volatility was low and the market was just moving sideways. After that, the
[03:34] price started to break down with momentum. And this is where I started paying attention. At this point, you can clearly see a strong red candle forming. And this candle is not just touching, but actually closing below both the
[03:47] lower Bollinger Band and the Keltner Channel. This is the exact confirmation we are waiting for. Also, notice one important thing. This is not a weak candle. It's a strong, full-bodied bearish candle with clear
[03:59] momentum. That's why I decided to take a sell trade here. Now, after entering the trade, this is where patience becomes very important. You can see the market moving in a straight line. There are small pullbacks, small pauses. And this
[04:14] is completely normal. Many beginners panic at this stage and think the trade is going against them. But if you understand market behavior, you'll know that after a breakout, the market often moves in steps, not in a straight drop.
[04:27] respecting the direction and not coming back inside the Keltner Channel strongly. That's a good sign that momentum is still intact. And finally, you can see the result. The market continues its downward move and the
[04:40] trade closes in profit. And in the next examples, I'll show you more situations where this strategy works and also where you should avoid trading. Now, let's look at a buy example. And this one is a very clean setup. If you observe the
[04:55] chart carefully, earlier the market was moving in a tight range. Bollinger Bands were staying inside the Keltner Channel, which clearly indicates a squeeze. So, at that point, there was no trade, only waiting. And this patience is very
[05:09] important. Now, here's the interesting part. After the squeeze, the market starts pushing upward with strong momentum. You can clearly see a powerful green candle forming and this candle closes above both the upper Bollinger
[05:22] Band and the Keltner Channel. This is exactly the confirmation we are waiting for. Also, notice the strength of the candle. It's not small, it's not weak, and there are no major upper wicks. This shows strong buying pressure in the
[05:35] market. That's why I entered a buy trade at this point. Again, no guessing, no prediction. Just following the setup step by step. Now, after entering the trade, watch how the market behaves. The price continues moving upward with
[05:50] momentum, forming consecutive bullish candles. There are very minor pullbacks, structure. This is a very important observation. When the breakout is strong, the market usually doesn't give deep pullbacks immediately. It continues
[06:05] in the same direction step by step. And here also, you can see that price is which means volatility expansion is still active. That's a sign that the trade is still valid. And finally, you can see the result. The market continues
[06:19] its upward movement and the trade closes in profit. In the next part, I'll show you more examples, including situations where this setup can fail so you know exactly when to trade and when to stay out. So, make sure you keep watching.
[06:33] Now, let's look at one more example. And this one is very important because this trade did not work. And understanding these types of trades is what actually improves your decision-making. So, watch this carefully. If you look at the
[06:46] chart, the market was already moving upward with good momentum. Then we get a candle that closes above both the Bollinger Band and the Keltner Channel. At first glance, everything looks
[06:59] perfect. Strong move, clean breakout, proper setup. So, naturally, I took a buy trade here based on the rules. But now comes the most important detail, which many traders ignore. If you look closely at that breakout candle, you'll
[07:14] notice something very important. Even though the candle is big and bullish, it has rejection from the top. The price tried to go higher, but it was pushed back down before the candle closed. This creates a small upper wick and that wick
[07:28] is not random. That is the market telling you buyers are present, but sellers are also active at higher levels. And after the entry, what levels. And after the entry, what happens? Instead of strong continuation,
[07:41] the market starts slowing down. Then red candles begin to appear. This confirms that the breakout was not fully accepted by the market. And this is the key concept. A strong breakout should have clean continuation, but a breakout with
[07:54] rejection often leads to failure. And finally, you can see the result. The market reverses, moves downward, and the trade closes in a loss. Now, this is very important. The setup was correct. The entry rule was followed. But the
[08:09] quality of the breakout was not strong enough because of that rejection. So, as you've seen, this strategy is not about taking random trades. It's about waiting for the right moment. First, the squeeze, then the breakout. And most
[08:23] importantly, the quality of that breakout. Because not every breakout works and that's completely normal. If you stay patient and focus on confirmation, your trade quality will improve over time. I've also created a
[08:36] free PDF guide where I've explained the setup step by step. You can download it from the link in the description and use it while practicing. If you found this video helpful, make sure to like and subscribe to Sam Trading Strategies for
[08:49] more simple and practical trading concepts. Thanks for watching. I'll see concepts. Thanks for watching. I'll see you in the next video.




⚡ Saved you 0h 08m reading this? Transcribe any YouTube video for free — no signup needed.