

I Withdrew $380K Using This Scalping Strategy
45sThe promise of massive profits from funded accounts hooks viewers immediately, making them want to learn the strategy.
▶ Play Clip"Delivers a usable strategy but oversells with income claims and lacks depth on risk management."
This video presents a scalping strategy for trading funded accounts, claiming to have generated over $380,000 in payouts. The strategy involves analyzing liquidity points on the one-hour timeframe and executing entries on lower timeframes (M1-M5) during specific trading sessions. The presenter explains two scenarios: selling when price breaks a high and buying when price breaks a low, using patterns like imbalances and structural changes.
The presenter claims to have withdrawn over $380,000 from funded accounts using this scalping strategy, applicable to companies like FTMO and Alpha Capital. He also mentions earning over €3,000 in a few hours.
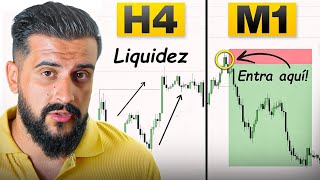
Analysis is done on the one-hour (H1) timeframe to identify liquidity points (highs and lows). Execution occurs on M1 to M5 timeframes, with M1, M2, and M5 being preferred.
When price breaks a previous high on H1, look for sell opportunities. The rationale is that most traders expect continuation, but price often retraces after liquidating stop-losses above the high.
When price breaks a previous low on H1, look for buy opportunities. Price often reacts upward after liquidating stop-losses below the low.
The strategy is best used during London session (9-11 AM Spanish time) and New York session (2-4:30 PM Spanish time). Only trade during these windows.
Using EUR/USD, the presenter marks liquidity points on H1 and waits for price to break them. He shows an example where price broke a high, leading to a sell entry with a risk-reward of 1:2 or more.
Look for a change in market structure (breaking the last low for sells) and imbalances (gaps between first and third candles in a three-candle sequence). Enter on the first or second imbalance.
The presenter claims to have taken this trade, earning over €3,000, and shows the price eventually reaching a 1:8.5 risk-reward ratio.
The strategy simplifies scalping by focusing on liquidity sweeps on H1 and precise entries on lower timeframes, with a recommended risk-reward of at least 1:2. It emphasizes trading only during high-liquidity sessions to maximize effectiveness.
What timeframes are used for analysis and execution in this scalping strategy?
Analysis on 1-hour (H1), execution on M1-M5.
00:30
What is the first scenario for selling?
When price breaks a previous high on H1, look for sell opportunities.
02:55
What is the second scenario for buying?
When price breaks a previous low on H1, look for buy opportunities.
05:13
What are the recommended trading sessions?
London session (9-11 AM) and New York session (2-4:30 PM) in Spanish time.
07:02
What is an imbalance in trading?
A gap between the first and third candle in a three-candle sequence.
11:54
What risk-reward ratio is recommended?
At least 1:2, never lower than 1.2.
10:17
Why does price often retrace after breaking a high?
Because it liquidates stop-loss orders placed above the high, causing a reversal.
04:46
Contrarian Approach
Challenges conventional wisdom by selling breakouts instead of buying them.
03:10Liquidity Explanation
Explains why price reverses after breaking highs/lows due to stop-loss liquidation.
04:46Imbalance Pattern
Provides a specific entry pattern using candle gaps.
11:54Real Trade Example
Shows a live trade with a 1:8.5 risk-reward, demonstrating potential.
13:28[00:01] very simple and profitable scalping strategy, with which I have personally withdrawn more than $380,000 in payouts from funding accounts. And be aware, this applies to very well-known companies, for
[00:15] example, FTMO or Alpha Capital. And I'm also going to show you an example so you can also going to show you an example so you can see how I managed to earn more than €3,000 in just a few hours. And be warned, this is not all. You will only need a couple of
[00:30] hours a day to operate it. The first thing I'm going to explain to you is the timeframes we're going to use to correctly execute the strategy. The first thing you need to understand is that the time frame for analyzing the points
[00:46] where we are going to look for those operations, those trades, will be based in a very simple and simplified way on the one-hour time frame . In the one-hour timeframe, what we are looking for is for the price to reach
[01:00] we are looking for is for the price to reach a liquidity point, whether it is a high or a low. Now we are going to explain what we are going to look for and what we are going to mark at those liquidity points, in that one-
[01:12] hour timeframe. And I'm also going to analyze an example for you later so that you understand it perfectly. Therefore, to help you understand, the analysis timeframe is the one-hour timeframe, and the execution timeframe, the
[01:28] timeframe where we will execute that trade after that one-hour point has already been settled, is the timeframe between M1 and M5. That's
[01:41] where we're going to execute our entry, or the trigger, as many people call it. Therefore, the analysis timeframe is one hour. Very simple and very simplified so as not to confuse or mislead us. Entry time
[01:57] mislead us. Entry time between 1 minute and 5 minutes. M1 M5 is where we will look for very precise entry patterns. In this video I'm going to explain some of them that I personally use. I'm also
[02:09] liquidity points, those maximum and minimum points that you should mark on the one-hour timeframe and how you should execute on a shorter timeframe. Therefore, the first thing we're going to do is go to the one-hour season and
[02:23] mark our analysis points at one hour, maximum and minimum. And we wait for the price to exceed that maximum, that minimum, that liquidity point, and then we would exit. to a shorter time frame between M1 and M5, 1 minute and 5 minutes.
[02:40] Therefore, you can use M1, M2, M3, M4 and M5. As a general rule, my entrances are M5. As a general rule, my entrances are usually in M1, M2 and M5, although you can vary according to your tastes and where you feel most comfortable, of course. What are we going
[02:55] to look for in the temporality of one hour? We have two scenarios, one for seeking sales and another for seeking purchases. This first scenario is for seeking sales. I'm sure you'll say, "Hey, if the price breaks a high,
[03:10] what's the point of me looking for sales?" Well, that's precisely why funding accounts, because the vast majority of people, when the price breaks a high, tend to keep looking for buys, when in most cases
[03:25] probability tells us that when the price breaks an old high, it usually retraces. That's where we're going to look for those sales. What would we look for in H1? Basically, the price breaks an old
[03:40] high. What we have here, where the price creates a kind of accumulation, is not necessarily necessary, to be redundant, to expect it to do a manipulation, but it is an old high, a high in the
[03:54] one-hour timeframe when the price surpasses it. Here we're going to look for some very precise entry patterns, which in this video I'm going to explain some of with examples, okay? Therefore, once the price surpasses a
[04:08] previous high, that's where our first scenario would be activated, which would be to look for sales. What I told you before, what are we looking for? Liquidity. Where is that liquidity located? At the highs and the lows. Therefore,
[04:20] we look for those price reversals. When the price exceeds a maximum, we will join in sales. However, when the price breaks a low, we will enter the buying position. I'm sure
[04:34] this has just thrown you off a bit because the vast majority of people price breaks a high, it believes it is in a bullish structure, an upward trend, and continues to look for buying opportunities. What's going on ? The price is not
[04:46] liquidated positions at that peak, pending orders, stop, take profits, and then it goes in the opposite direction, which is what we are going to look for. When the vast majority of people have forced it out
[05:00] of the market because its stop-loss has been triggered, that's when we're going to execute our sale. Therefore, in the first scenario, in summary, when the price on the one-hour timeframe breaks a high, we look for sell opportunities on the
[05:13] timeframes I mentioned earlier between M1 and M5. This would simply be the first scenario: to look for sales. And to look for buying opportunities, we're going to wait for the exact opposite: when the price reaches a minimum
[05:27] within an hour, that's where we'll step in, looking for our entry pattern to find buying opportunities. Because? Precisely because of what I mentioned, the vast majority of people, when the price breaks a new low,
[05:40] fall indefinitely. What is the reality? that most of the time the price tends to react because it has liquidated many positions, including liquidated many positions, including many stop-loss orders that were
[05:54] below those lows or above those highs when we were looking for sales. precisely the opposite. When the price takes a minimum on the price takes a minimum on the one-hour timeframe, we will look for
[06:08] our pattern here. So that? To try to get involved in purchasing. Because? Because there is a lot of liquidity below the lows, where the vast majority of people hedge their positions because it is impossible to hedge elsewhere in the
[06:22] market, so people hedge, they place their stop-loss orders at previous lows and highs . That's where the vast majority of the money is. Therefore, when the price exceeds its points, it liquidates those positions, all those
[06:35] stop-los accumulated there, which is what makes it move back in the opposite direction. Therefore, we are looking for sales above peak levels. and we look for above peak levels. and we look for purchases below the lows. Something very
[06:48] simple. All this to simplify it as much as possible and not get confused or confused, we will look for it in the time frame of one hour. And now I'm going to show you the patterns we're going to look for to find and
[07:02] execute our strategy in favor of either the first scenario or the second scenario. And as I mentioned at the beginning of the video, you can only use this strategy for a couple of hours a day. I personally have two
[07:17] which would be the London session, which is when the London Stock Exchange opens, and the New York session, which is when the New York Stock Exchange opens. What are the opening times for those stock exchanges? Well,
[07:32] London's time zone is from 9 a.m. to 11 a.m., Spanish time. And the New York schedule, the opening of the New York Stock Exchange, we will operate it from 2 pm to 4:30 pm. This is the time in Spain. If you are from any
[07:46] other country, you simply convert the time and you will see what those times are in your country. You can operate this strategy in one of the two sessions or in both sessions depending on the time you want to trade, depending on your
[07:59] work, your personal life or how you want to manage yourself. You can only use the London session or the New York session, trade both and personally recommend that you only keep an eye on the market, keep an eye
[08:12] on this strategy and execute our trades, our operations within these two times, 9 am, 11 am, London time, or New York session, which would be from 2 pm to 4:30 pm. That's where
[08:26] we'll wait for those clearances from those highs and lows, and enter into sales or purchases depending on the scenarios that occur and whether it breaks a low or a high on the one-hour timeframe. And now I'm going
[08:40] understand everything perfectly. We are dealing with the euro-dollar currency pair, which I personally only trade to keep things simple and avoid overthinking it. I came to trading to make money,
[08:53] not to stress myself out and have tons of assets to analyze. Therefore, I only trade the euro-dollar pair. But you can analyze this. You can use this strategy with any other asset, whether it's futures, Nasdaq, Gold, any
[09:07] other currency you want, but I personally trade Euro-Dollar. What have we found here? We are on the one-hour timeframe, as you can above, and what we are going to mark are the liquidity points, highs and lows
[09:22] to wait for the price to liquidate those points within our trading session, London session or New York session. And based on the point at which the price settles, we will look for scenario one or scenario two, sales
[09:36] or purchases. Here I have marked the scenario to look for purchases, which would be this minimum here in the one-hour season. And to look for sales we would have to wait for the price to clear the maximum we have up here
[09:48] see, we have a maximum here and a minimum here. Therefore, what we are going to look for are purchases in this section and sales in this section. If you manage to find and enter a sell position here, you can take your
[10:03] take profit to the next liquidity point or even extend it further depending on what you see and what the price is doing, whether it generates a Based on that, you'll decide whether to extend the take profit further or not. I
[10:17] personally recommend that you go for a risk-reward ratio of 1 to 2 or more. Never go for a profit ratio lower than 1.2 because this means your win rate a lot of trades. Therefore, I
[10:31] recommend at least going to one or two. Therefore, once we have marked will simply have to wait for the price to settle one of those two
[10:43] points, either to look for buys or to look for sells. We're going to a as I've explained, we're going to look for entries between 1 minute and 5 vary the time frame to see which one gives us the most
[10:57] optimal entry with the highest ratio, so we can obviously earn more money, which is what we are minute season and we're just going to wait for the price to reach that point we have here. We see that the price has already reached its maximum, therefore what we are
[11:12] selling scenario, as I said before, if it surpasses the maximum, we look for selling, if it surpasses the minimum, we look for buying, that is what we are looking for in the strategy. The price has already reached the point and as you can see here the London session is starting, the
[11:25] morning, you can see it below, 9 in the morning, we would already have our first entry pattern. What are we looking for? Well, let the price bring about a change in structure means that the price breaks, in this case where we are looking
[11:40] for sales, that it breaks the last low that created the last impulse. What 's that point? This one right here. Create a minimum, create an impulse, and that will already bring about the structural change. The price gives us an impulse and creates an
[11:54] imbalance. It creates one and two of us. What is an imbalance? Basically, a gap between the first candle and the third candle in a sequence of three candles, where the first candle, which would be this one here, and the third, one, two, three, these two do not
[12:07] would be a void. And here another imbalance sequence is created: one candle, two candles, three candles. A sequence of three candles where the first and third candles are not touched . Therefore, it creates two
[12:19] gaps for us. Where do we go? Basically, we execute our command in the first empty slot or the second empty slot, depending on what we want. And we can look for our take profile at 1 to 2 or up to the next liquidity point, which would be
[12:33] the next low, which would be this one here, giving us a ratio of almost here, giving us a ratio of almost 1 to 2. This would be the execution of see, the price plummets very easily. It would have already
[12:48] given us the 1 to two, which we would have here, it would have already given it to us in just a the 5-minute time frame, which it also does. Look here, a sequence of three candles: first candle, first candle, second, third. It creates a
[13:01] gap, and here we can insert our entry if we want, okay? Therefore, look, in 2 minutes we would also have our entrance sequence. in 2 minutes. It doesn't create that
[13:15] void here, it would create it further down or in these higher up here, okay? And in M3 it's practically the same. Sequence of imbalances, of impulse. And there we would have it . in the 2-minute season where he personally makes it look the most
[13:28] beautiful. And I'm not just explaining this trade to you , I actually took this trade myself. You'll earn more than €3,000, and my students also earned it with me because I to look for sales above this
[13:41] high. I'm going to leave the trade here for you to see that I took it, besides that it's totally true and this strategy really works. And the price eventually melted down to the next point we have
[13:56] here. Let's take a look. The point I told you about was giving us almost a 1 to 1 risk-reward ratio, and the price kept pushing. Notice that it practically reached 1 to 8 and 5 risk-benefit. Absolute madness. This is the end of
[14:09] , and that you'll apply it. By the way, below you have a free lesson where I explain this strategy completely free of charge and in more detail. And you can also find me on Instagram @bilesdalgo, in case you want more information or have any
[14:22] strategy questions, you can find me there.



⚡ Saved you 0h 14m reading this? Transcribe any YouTube video for free — no signup needed.