
The Simple Pattern That Predicts All Chart Trends
44sThe hook promises a definitive method to predict trends, which is highly intriguing for traders seeking an edge.
▶ Play Clip"The title promises an 'infallible method' but delivers a basic trend-following principle with some practical examples; it's solid but oversold."
The video presents a foundational trading principle: identifying market trends through the analysis of swing highs and lows. The presenter argues that this simple method is the key to predicting chart movements and emphasizes that trading in the direction of the trend is mathematically more profitable than trying to catch reversals. Using Bitcoin and another asset as examples, the video demonstrates how to apply this analysis in real-time and introduces a three-step framework of analysis, filtering, and triggering.
A pattern always occurs before a trend, especially at reversals or the end of a trend. The presenter claims to show a definitive way to understand and predict all chart movements.
The biggest difficulty in trading is not analysis but the trader's own actions and emotions. Decisions based on emotion interfere with the chart's message.
Every trend movement has tops and bottoms. An uptrend is characterized by higher highs and higher lows, while a downtrend has lower highs and lower lows.
The word 'trend' implies a tendency. It is easier to trade with the trend than to find the exact reversal point.
With 10 points in a trend, only the 10th point is the reversal. Thus, there is a 10% chance of picking the exact reversal, while the other 9 points are profitable if trading with the trend.
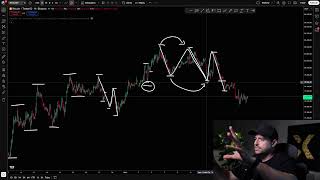
On the 1-hour Bitcoin chart, the market rose from early April, hitting 83,000 and pulling back to 77,000. The presenter identifies a series of higher highs and higher lows, then a level top and a break below a previous low, signaling a potential reversal.
A false signal occurred when the market made a lower low but then recovered. The presenter notes that mistakes are part of trading, and trading with the trend limits losses.
A lower low and a lower high indicate a bearish pivot, but if it's near a safety bottom, it may still be sideways. The market eventually broke down, confirming a downtrend.
The presenter introduces a three-step framework: analysis (observing tops and bottoms), filtering (using candlestick patterns, indicators like moving averages or RSI), and triggering (the entry point).
On a 15-minute chart of another asset, the presenter shows an impulsive move up, then a sideways phase with lower highs and higher lows, followed by a break below a previous low, signaling a downtrend.
Tops and bottoms are the most basic and essential part of market analysis. Trading against the math is trading against profit.
In large institutions, there are separate roles for analysts and traders. Analysis is a crucial part of the process, not just clicking buy and sell.
Trading is based on analyzing the past, understanding the present, and predicting the future. All successful methods, like support/resistance and SMC, are based on patterns that worked in the past.
The video concludes that mastering the analysis of swing highs and lows is the fundamental skill for trading successfully. By trading in the direction of the trend and using a systematic approach of analysis, filtering, and triggering, traders can align themselves with mathematical probabilities and avoid emotional decisions.
What characterizes an uptrend?
Higher highs and higher lows.
01:39
What is the mathematical probability of picking the exact reversal point in a trend with 10 points?
10% (1 out of 10).
03:07
What are the three steps in the presenter's trading framework?
Analysis, filtering, and triggering.
08:07
What is the 'filter' in the trading framework?
A candlestick pattern, repetition of candlesticks, or an indicator like a moving average or RSI.
08:35
What does the presenter say about trading against the trend?
Trading against the trend is trading against the math and against profit.
12:15
Mathematical Advantage of Trend Trading
Provides a clear statistical rationale for trading with the trend rather than trying to pick reversals.
02:37Analysis, Filter, and Trigger Framework
Offers a structured approach to trading that separates analysis from execution, useful for systematic traders.
08:07Trading is Based on the Past
Emphasizes that all trading methods are derived from historical patterns, reinforcing the importance of backtesting.
13:16[00:02] before a trend on a chart happens, whether it's an uptrend or a downtrend. It mainly appears when we are about to see a reversal or the end of a trend. I know it might sound strange for me to
[00:14] say this, but today I'm going to show you a definitive way to understand and predict all the movements on the chart. I'm not saying you're going to have from now on, or that you've found the holy grail. No, but I'll prove it to you.
[00:29] In the chart, there's a pattern that always occurs; it's very simple, but many people end up overcomplicating trading and operations when they should actually be making things easier and
[00:43] difficulty isn't in the analysis, it 's not in the chart. The biggest difficulty, do you know where it is? In your little finger, in your actions, in your mind, because because you often make decisions based on emotion, when all you have to do is
[00:57] look at what's right in front of you in a simple way. If the chart speaks to when you introduce too much interference, the graph can't communicate with you; there's no way to understand what it's saying. It's OK? Next, if you
[01:10] like this video, please leave a like. I'm not going to ask for likes right now. Every trend movement has tops and bottoms. This is something very simple, but many people forget it. If the market is trending, is that where you're going to make
[01:24] money? Upward trend, downward trend, and also sideways movement. depending on your strategy, but generally you want to trade either way, in an uptrend or a downtrend, right? What is the
[01:39] point I'm trying to make? To understand a trend, you always need to remember that we will have a low point where the market reached, went up, made a high, went back down, made a higher low than the previous low, and a higher high
[01:54] than the previous high. This characterizes it as a bullish pivot, an upward trend movement, at least in the short term. And as long as we don't have a different signal, that is, a reversal, a higher high and a lower low
[02:09] than the other, in this case, an uptrend, to reverse it would have to Until that happens or there 's a lateral movement, what upward trend. If the trend is upward, what does that mean? The
[02:23] upward, what does that mean? The name itself says it all: trend. It tends to , why would you say it's going down? It's much easier to it's going down? It's much easier to
[02:37] find the point where a trend reverses. Just think about it this way, mathematically speaking, here we have one point, two points, three points, four points, five points, six points. Okay, so, 7 8 9 10. OK? Look, here we have
[02:54] so, 7 8 9 10. OK? Look, here we have 10 points of a trend, OK? 10 points of a trend, OK? Whichever point you took a trade from—1, 2, 3, 4, 5, 6, 7, 8, or 9— when the
[03:07] would be in profit. If you had made a buy order, without a stop-loss order, just a buy order, because here you bought and it reached the top, even if you had bought here, it would have gone up a little, right? What is the
[03:21] point that would trigger a reversal? Only with 10, that is, out of 10 possible entry points, you have a 10% chance of finding the exact reversal point. The rest are small movements, quick movements, they are
[03:34] noise on the chart. Any of the other spots could have been picked and they would have advantageous to trade with a trend than to try to find the reversal point. Mathematically speaking, if you're trading in favor of a
[03:47] trend, it's on your side. And this movement of tops and bottoms, it you'll understand what I'm talking about. I'm going to look at a already analyzing. Let's take a look at the Bitcoin chart itself. Let's pull
[04:01] this up on Binance and I'll set the chart to one hour, okay? This type of timeframe, because it's the principle, the basic concept of the market. Obviously, basic concept of the market. Obviously, time frames from 15 minutes onwards are
[04:16] more interesting because they have less noise, right? Awesome! So, Bitcoin has recently started to rise quite a bit since the beginning of April, right? And now it's been properly fixed. He hit 83,000
[04:31] practically and now he's back down to 77. Let's understand exactly what happened . So, the market was down here, then it moved
[04:43] sideways, right? And starting here in early April, it began an upward trend. This upward trend, if we look at it in a very simple way, we had bottom, top, bottom, top, bottom, top, bottom, top
[05:00] had bottom, top, bottom, top, bottom, top, bottom, top , bottom, and it goes on top, bottom,
[05:12] top. Oops. Let's stay alert here. Why? Top leveled with previous top. And here we had a sail that surpassed the
[05:24] previous bottom. In this case, it's no longer an upward trend; it's either sideways movement or a reversal. To know if it's a reversal or not, you need to find a
[05:36] signal, okay? And then, in the very short term, we had this movement, this little peak, this little trough, this longer-lasting peak here, and
[05:48] an even lower trough. So here we had a sign of a drop, but the market didn't continue to fall, okay? So this would have been a false signal. I have because when you trade the trend and it goes wrong,
[06:01] you make a mistake there and lose very little. Now, when lot of money. So it's okay to make mistakes. Making mistakes is part of a trader's life , okay? Then the market recovered, continued rising, and this proved to be
[06:16] a bottom, it made a top there. OK? However, let's analyze what happened here. We had, oh, the bottom here, the top, the very bottom here, okay? The price movement was downward, reaching a lower low
[06:32] than the previous one, but it was still not lower than that last low. It started to rise again, oops, it leveled off the top again, it didn't make a higher peak . It's clear that we're in a lateral position. And here we had a
[06:46] lower low than the previous low, okay? So here, this peak in relation to this one is lower, it's slightly level, but it's lower. And this bottom here, look, this one is lower than this one . So this is a bearish pivot, but
[07:04] since it's very close to this bottom, to the previous bottom, which is the safety bottom, we can say that it's still a sideways movement. So let's continue observing the movement of the graph. Formation here
[07:16] movement of the graph. Formation here at the top, right? And when we had a breakout from that bottom again, it held here, but then, boom, it broke through.
[07:28] OK? So, yet another pivot, most likely a most likely a downward trend, right? Definitive. And it downward trend, right? Definitive. And it 's no coincidence that the market picked up and
[07:41] started to rise a little, and then fell further. We are in a downward trend. Ah, but it took a while to identify. It depends. In the scenario I mentioned that went wrong, the single pivot point at the bottom was already
[07:54] this be taken into consideration here? Yes, this pivot, boom, the market is no longer going up, it will most likely fall, okay? But where am I supposed to go in? So, my friend, you can look for a reason to
[08:07] enter using SMC, price action, an indicator, whatever the reason may be. If you understood the principle, the trend, it's already too late. When I trade, I usually say that there's analysis, filtering, and triggering. Analysis is part of this
[08:21] observation of tops and bottoms. It's a principle. It's what allows you to operate or prevents upward trend, which will allow you to trade in favor of the upward movement. It's in a downtrend, which will allow you to trade in favor of the decline. So what is the filter then? It will be a
[08:35] candlestick pattern, a repetition of candlesticks, some indicator you use, a indicator you use, a moving average or an RSI, something like that. And that's the trigger. The trigger is the entry point, right? So,
[08:49] based on the peaks and troughs, you can predict the movements of the chart. I'll show you another example here now. Let's pull in another asset. Let's pull,
[09:06] that many people enjoy trading, right? And let's observe here, look. Take a shorter-term approach. Go. 15 minutes. 15 minutes. Short-term movement. It's OK. Oh, here we had an impulsive movement. Beauty? Bottom,
[09:23] impulsive movement. Beauty? Bottom, top, bottom. It went up, up, up, up, top, bottom. It went up, up, up, up, top, bottom. Oh, it started to turn sideways here, look. We had a lower peak, a
[09:37] higher bottom, a level peak, a slightly higher bottom, sideways movement. OK? When that happens , you don't even need to worry. Look at the basics, the raw material, which is the top and the bottom. He finished. Then he went up there, okay? Bottom here, top
[09:51] Then he went up there, okay? Bottom here, top here, all good, right? Boom, the market came and already made a lower low here than the previous low. Then it went up, making a slightly even going to consider that one. This quick move here, I'm not even going to consider it.
[10:06] more accurate, but let's suppose that in real time you imagined it was just noise, a false breakup, something like that, okay, let it flow, right? Then the like that, okay, let it flow, right? Then the market came, boom, and that's where he made this
[10:18] market came, boom, and that's where he made this fund. And here he caught it and turned sideways, boom, he went up. Okay. Then it went through this bottom again , look. It made a lower bottom. This is a hell of a drop pivot, a
[10:33] low pivot. That being said, have you thought about it? Okay, the upward trend has said, have you thought about it? Okay, the upward trend has selling points. And then you look for places where you can make sales. Then you think,
[10:47] but the graph didn't fall, it fell later here, right? Because he picked it up, it took a here, right? Because he picked it up, it took a while, and then it all fell apart. OK? But if you've noticed this and it's the first big sign and you already want to look for a
[11:01] sell operation, you're going to look for a trigger. Within that price range, you can use whatever you prefer. Or you can expect a more efficient trigger by observing the tops and bottoms. So here it was a
[11:14] slight breakout, it came back, the same scenario that had happened with Bitcoin. It takes time to give an indication, otherwise it would be too easy, right? He deceives you only to very short-term deals, in which case he usually respects you very quickly. So, it came back, made a high here at the
[11:31] bottom, the market was sideways, right? But what also determined this fall was this peak, this trough, this peak lower than the previous peak, and then a trough here, lower than the previous trough, and that's what happened.
[11:45] Boom, it exploded down there. Right? So, tops and bottoms, uptrend, downtrend, the most uptrend, downtrend, the most ridiculous thing there is. It absolutely cannot be ignored
[11:58] . It cannot be ignored, because it is the principle, the foundation, part of the analysis, the overall context of the market. If you trade against what the math proves is good, you're trading against the math, you're
[12:15] trading against profit. If you want to make a profit, you have to operate in a minimally intelligent way. And the basic thing to do is to perform this analysis. Many people perform this analysis. Many people look for something complex, indicators, and
[12:28] elaborate triggers, but they don't do the basics. A basic market analysis. 's easy to see in a static graph, I want to see it in real time." Do you know why? Because they are people addicted to operating and have great difficulty
[12:46] analyzing. I don't know if you're aware, but within a don't know if you're aware, but within a large institution there are analysts and large institution there are analysts and traders,
[13:00] function. Do you think you're just going to click buy and sell? If you don't do your part in the analysis, you won't do well. and operate, make money with trading. Do you know what that is? Analysis of the
[13:16] past, understanding of the present, and an attempt to predict the future. So you look back to understand what's happening now and to make a decision trying to understand what
[13:30] will happen in the future. Anyone who says this concept is wrong, excuse me, is stupid. Because everything in the trading world is based on the past. So who says that by
[13:42] analyzing past charts, everything you do—support, resistance, SMC— is based on patterns that worked in the past? No one who is successful and gets results uses something they just pulled out of thin air, saying, "Oh, I'm going to use
[13:55] think it'll work." No, it was analyzed whether it worked before or not, man. Did you understand? And that's what analyzing the past, understanding the present, and the past, understanding the present, and trying to predict the future means. It's OK? If you
[14:08] enjoyed it, leave a like and subscribe to the channel for more content. M.



⚡ Saved you 0h 14m reading this? Transcribe any YouTube video for free — no signup needed.