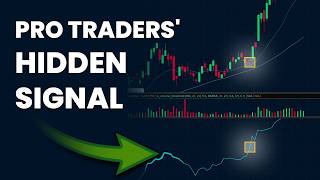

The Signal Before Big Stock Moves
43sHigh curiosity hook about a hidden signal that predicts stock breakouts before they happen.
▶ Play Clip"The title promises a 'secret signal' and the video delivers a specific, actionable concept with examples, though it's padded with podcast banter and sponsor reads."
In this episode of the Trading Floor podcast, hosts Tim Beldin, Garrett Dryen, and Kurt discuss the concept of 'hidden relative strength'—a subtle but powerful signal that can help traders anticipate breakouts before they happen. They explain how to identify stocks that hold up better than the market during downturns, the institutional buying behind this phenomenon, and how to use a volatility-normalized relative strength indicator to time entries.
Relative strength compares a stock's performance to the market. Hidden relative strength is more subtle: it's when a stock holds up better than the market during down days, showing resilience and underlying buying interest.
Hidden relative strength is actionable because it can lead to trades. It's not about looking at it every day; it's about spotting it during market weakness to identify potential breakout candidates.
The strongest stocks often have institutional buying behind them. On down market days, big funds add to positions via TWAP (Time-Weighted Average Price), creating an underlying bid that shows up as hidden relative strength.
1) Scanning: Create a list of stocks that show relative strength during market pullbacks. 2) Timing: Use it to anticipate breakouts in stocks you're already watching, as they often show relative strength before breaking out.
Garrett notes that 90% of the best breakouts they trade show relative strength before the breakout in subtle ways. This makes it a key tool for teeing up trades.
Tesla breakouts are a signature example. Before breaking out, Tesla often shows relative strength compared to the Q's (QQQ ETF). The hosts show a chart with a relative strength line that breaks out before the price.
To measure hidden relative strength, they use an indicator that normalizes for volatility. Each bar's move is divided by the ATR (Average True Range), creating an ATR-adjusted cumulative return. Then subtract the benchmark's ATR-adjusted return from the stock's.
SNDK (SanDisk) showed hidden relative strength before its breakout. The relative strength line broke out while the stock was consolidating, even on a day when the market had a big down day. This signaled a hidden bid and led to a trade.
Hidden relative strength is not a buy signal. It's an alert to move a stock up your watch list. You wait for the market to turn or a breakout to occur before entering.
The real value is in ranking your watch list. Hidden relative strength helps you prioritize which stocks are most actionable, saving bandwidth and focusing on the best opportunities.
Hidden relative strength is a powerful, actionable signal that helps traders identify stocks with institutional support before they break out. By watching for stocks that hold up better than the market during downturns and using a volatility-normalized indicator, traders can rank their watch lists and be prepared for explosive moves.
What is hidden relative strength?
A stock that holds up better than the market during down days, showing resilience and underlying buying interest.
02:06
Why do strong stocks often show hidden relative strength?
Institutional buying via TWAP on down market days creates an underlying bid.
05:38
What are the two ways to use hidden relative strength?
Scanning for stocks and timing breakouts in stocks you're already watching.
07:32
How do you calculate the volatility-normalized relative strength indicator?
Divide each bar's move by the ATR, accumulate these values, then subtract the benchmark's ATR-adjusted return from the stock's.
12:22
What percentage of good breakouts show relative strength before the breakout?
90%
09:15
What is the 'pink line'?
A breakout level that traders watch for a stock to break above.
03:15
Is hidden relative strength a buy signal?
No, it's an alert to move a stock up your watch list, not an entry signal.
24:37
Institutional Footprints
Explains the fundamental driver behind hidden relative strength, linking it to institutional buying behavior.
05:3890% Success Rate
Provides a concrete statistic that validates the effectiveness of the signal.
09:15Volatility Normalization Technique
Offers a specific, replicable method for measuring relative strength that accounts for volatility differences.
12:22Alert, Not Entry
Clarifies the practical use of the signal, preventing overtrading and emphasizing patience.
24:37[00:01] obvious, you're 100% late. You aren't the hunter, you're the exit liquidity. The easy money has already been made. Anyone can tell you a stock is strong [music] when it's up 100%. But there's a way to tell a stock is strong before it
[00:16] makes its move. We call it hidden relative strength. This is the quiet the rest of the market is looking the other way. It's not sexy. It won't make your ex feed, but it [music] works. We're going to discuss how we spot
[00:31] it, and how we [music] use it to anticipate breakouts. It's time to [music] relative strength. Welcome to the Trading Floor podcast, episode 9.
[00:43] I'm Tim Beldin, joined as always with Garrett Dryen and our guy Kurt behind So Garrett, when we're saying hidden relative strength, what do we mean?
[00:55] So when a lot of people talk about strength, they're talking about a really strength, they're talking about a really strong stock. And relative strength another or one stock to the market, right? Everyone knows that. But I think
[01:09] that a lot of times when we talk about relative strength, the thing that stands out to us is the strength part, right? So something that has tremendous that's just running. It's the strongest stock in the market. It's super obvious.
[01:23] But there are other kinds of relative strength that are more subtle, but like in our case, and you'd probably agree with this, Tim, like more powerful because there's a way to use it to our advantage. Now, a stock that's up, you
[01:38] probably going to have some pretty serious relative strength, but it's like the cat's out of the bag, right? So, yeah. So, so what is this this hidden relative strength that we're talking about that is a little more subtle? You
[01:53] you can measure it. You can easily measure it, but it's different than just strong. >> And what you're getting at, it's actionable. Like it's something where you find hidden relative strength and
[02:06] that could lead to trades and you don't want to be looking at it every single day. So, like you said, relative strength, we compare the strength of a stock to the indices to the market. And for hidden relative strength, we really
[02:20] want to be looking at it when the market is having down days. When the market is weak, what's standing out and holding up the best? And that's what gets us excited. >> Yeah, absolutely. So, it's it's a stock
[02:33] that isn't going down when the market's going down. So, if we're going to because that's a really great proxy to say, you know, is our stock stronger or weaker than the market, we can compare it to SPY or Q's or maybe it's it's ETF,
[02:47] it's sector ETF, you know, there's different things we can do there. Um, different things we can do there. Um, but we might it might be as simple as we're watching our stock, right? And and we we use this for breakouts, right?
[03:00] a breakout. We're trying to take the temperature of the stock. We want to get the feel for is it ready, right? It's trading in the range. It's maybe testing getting close. It's getting tight. Like there's various reasons why we're
[03:15] watching it a lot closer now. And we we're really trying to like time this thing. And and like the last episode when we talked about the pink line, that breakout level where we might anticipate that breakout level or we
[03:29] might wait for that break, right? And one of those things that might get us to anticipate is relative strength. >> Would you like to gain the biggest edge a retail trader can get? All of our daily and weekly in-house trader
[03:45] meetings are now available to you. Just head over to smbtradingfloor.com >> And it's really that hidden relative strength. So it might be as simple. So watching the market. Like there's ways to measure this and we'll like I want to
[04:00] actually get into that Tim because I brought a couple slides of of a of an indicator that I created that I like to to use to measure this especially on the >> But so but it's usually as simple as like
[04:15] I'm I'm just watching the stock >> and you notice that the market ticks down, right? you're watching the spy at the same time as your stock and maybe there's a downdraft in the market and you're watching your stock and maybe it
[04:29] doesn't go down as hard, right? Maybe there's some bids there, maybe it holds, maybe it doesn't go down at all. And that's just a little instance within that day that it demonstrated some relative strength, some resilience,
[04:42] something that like something's there, there's a bid there, there's something there that that shows some buying, right? without it kind of having to go up 10% before you realize that. Right? So, you're collecting these little data
[04:56] points as the market drops and your your stock holds. The market drops, your stock holds, right? Maybe the market rallies a little and yours goes more. Maybe the market starts to consolidate and the stock, you know, keeps going a
[05:09] little bit higher. There are these little moments that are qualitative that we can see when we're watching the tape. So simply put, it's like the Q's are So simply put, it's like the Q's are down 2% on the day. What is green?
[05:23] What's positive on the day? Or if the market's down 2 to 3%, what's only down like 0.25%. And I think what's interesting, you're saying the underlying bid. What I find so interesting with hidden relative
[05:38] strength is that there is a fundamental driver behind it where the strongest stocks usually they make the biggest most explosive moves because they have institutional buying behind it. And we know these are huge funds, huge firms
[05:54] where they can't execute everything in a day. Like if they want to buy Tesla or SNDK, you can't do it in one single day. So on those down market days, you're getting that big money still adding to their positions via a TWAP. And that's
[06:11] kind of uh the dynamic that is that underlying bid that we're talking about, >> right? It's it's like the footprints of those those institutions and it's the those those institutions and it's the really the market showing you its hand,
[06:24] >> right? The market having those down moves gives you an opportunity to see which stocks have bids in them. And that's why like our team leader K Fitz He's always talking about like every time we get a weak day in the market or
[06:38] even just like a weak period in the market that's like that's his time to start collecting his list of strong stocks, right? It's not after they've all gone up 10%. It's when the market's going down and he's just looking and
[06:52] just adding stocks, adding stocks like this stock, this stock, and and by by the time the pullback is over in the market, he has this list of relatively strong stocks. And it's typically once that market turns, those are the stocks
[07:05] that are going to explode. And that's those are the stocks that he ends up swinging trading like on the way back up, which is I mean that's like his whole strategy. >> Yeah. And he's he's made a lot of money
[07:17] >> Yes. >> Yeah. >> So, the blueprint you're saying is when the market is down, he'll send the text the market is down, look at what's holding up the best. Like, simply put,
[07:32] finding hidden relative strength in stocks. >> Yeah. So, I like to me there's like two ways to use this. Like one, you're scanning for stocks. So you're trying to create a list of stocks that are showing
[07:46] like you can keep your like relative strength list and now you know these are stocks when the market gets strong might outperform, right? They might set up and watching. So that's kind of like a a scanning way to go about this. The the
[08:03] other way is like you've got a stock that's setting up and this is kind of >> Yeah. And this is kind of like where I was um thinking like going into this. Like we didn't talk a lot about this this uh this episode, but that's kind of
[08:17] right, you can use it to scan the stocks. Where my head was at was you're watching a stock for a breakout and you're trying to figure out when it's ready, right? Because we're always like, you know, there can be failed breakouts.
[08:31] anticipate if it's not going to go and you know you want to wait for the pink line you know regarding last episode and all those things and so you're trying to time it and there's something about when you're watching for a breakout that
[08:46] consolidation a lot of the times the stock's underperforming like it might you know it's pulling back it's resting after a big move um there's some volatility there and then it's and it starts to go sideways and at some point
[09:00] it starts showing some relative strength before it breaks out. And I would say that like I mean 90% of the time when I go back and like look at my indicator times we're computing this like qualitatively as we look at the market.
[09:15] But if you go back and and look at this, I mean 90% of the breakouts that are really good that we trade like they start to show that relative strength before the breakout in these really subtle ways. And so that's like one of
[09:28] my favorite ways to start teeing up a breakout is because you start to see that. And I I remember distinctly um I think it was like the Tesla 360 breakout last year. It consolidated for weeks um off that April low. It came off
[09:44] and then broke out like I think it was through 360. And it was like the few days leading up to the breakout it was just obvious relative strength. And I
[09:56] >> let's look at it. >> Yeah, Kurt, if you could please bring up the uh the Tesla slide. I think it's number number two. >> And Tesla's our favorite in terms of like I don't remember a Tesla breakout
[10:10] that didn't show relative strength right before it broke out. Like that's a signature for Tesla breakouts. >> Yeah. Yeah. And and so this is so Tesla >> Yeah. Yeah. And and so this is so Tesla is on the left and the Q's are on the
[10:22] right. So that I'm just comparing Tesla to the Q's. And that line on the bottom of the Tesla chart is the relative strength line. Now Tim, you know,
[10:34] sometimes I like to do things differently. A lot of times, like most quantify relative strength, I think like the traditional way to do it is like a a dividing um like one stock by the other and and
[10:48] you're you're plotting that line, right? and the the movement of that line shows the relationship between those those two stocks. And that works great when you're stocks. And that works great when you're comparing two very similar um types of
[11:01] equities with similar volatility and stuff like that. And I I think as in a broad stroke kind of way like that's that's a great way to do it. Um for me like the issue with that is that it doesn't really normalize for volatility.
[11:16] lot more and you're trying to compare it to something that doesn't move nearly as much. So like for instance, if Tesla moves a lot more than the market, so te the market's up 2%, Tesla's up 4%.
[11:30] the market's up 2%, Tesla's up 4%. Market's down 1%, Tesla's down 2%. Right? It's just Tesla's doing the same thing as the market. It's just more volatile, right? In a situation like that, a lot of these traditional
[11:42] relative strength lines are going to end up just looking like the chart of Tesla, like a like a sort of subdued chart of Tesla because Tesla's going to dominate because it has more volatility than the um than the instrument that you're
[11:55] comparing it to. So, what I like to do is normalize for volatility. And this this is an indicator that that we share in in the Bionic Trader meetings. >> Do you want to sit in on all of our daily and weekly in-house trader
[12:07] meetings? There's no bigger edge retail traders can get. Visit to learn more. >> Just really quickly, Tim, explain like how we compute it so that like people at home can do it and understand it. Um,
[12:22] >> And definitely, you know, basically you're like I'm taking each bar >> which think of each bar as a move in the stock, right? You're going from like the could be on any time frame. It's just the calculation on whatever time frame
[12:35] you're on. Every bar is a move in the stock. And so for every move in the stock, you're taking that move and you're dividing it by the ATR, which is the average true range. So there's a rolling calculation of an average true
[12:48] range, which is the volatility of the stock. And you're taking that move and you're dividing it by the ATR. And then you take the next move and you're dividing it by the ATR. And so now you have a chart of these ATR moves and
[13:00] you're accumulating those. And so as the volatility is changing, the uh the moves are adjusting to that volatility and you're basically getting an ATR adjusted cumulative return of the stock, right? And so you do that for Tesla and then
[13:16] you do that for the Q's. You take Tesla minus the Q's. So you just subtract the benchmark from your stock. And >> so just to stop you real quick, you're normalizing using the average true range.
[13:30] difference. So like you're you're taking two separate lines and then you're subtracting one for the other. Each line is a normalized like ATR return of the
[13:43] >> During the same time period and so that way um you're basically saying like for Tesla's volatility Tesla has performed this way and for the
[13:55] Q's volatility the Q's have performed this way. So we've now taken the they normally move, which one's outperforming, >> yeah, it's so interesting. >> And so like if if say Tesla typically
[14:11] always just does double the percent move as as the Q's. >> I'm just making that up. >> So now if the Q's go up 2% and Tesla That on the relative strength line, that's going to be like they did the
[14:24] same thing. >> And that's that's what that's doing. And thing. It'll be a flat like Yeah. It'll >> Yeah. Like they both they both did the same thing. So that's what the line is
[14:36] down at the bottom. And so that's plotting the relative strength of Tesla compared to the Q's. And you can you can see it pretty clearly because you see that day one, this is over the course of three days. And you can see those
[14:48] vertical lines on the chart are splitting Tesla and the cues up into splitting Tesla and the cues up into three days. And you can see on day one how Tesla rallied in the morning, flatlined in the afternoon, and then
[15:00] kind of sold off into the close. Kind of closed where it started. And you can see that the Q's actually kind of sold off all afternoon >> and and rallied into the close a little bit, right? Which is so when when the
[15:14] Q's rally into the close, you can see that relative strength line in Tesla dip the close, the Q's are outperforming. So, but you can see as a whole Tesla can see that in the chart and you can see it on the relative strength line.
[15:29] And so, what's so interesting about this is that we weren't looking at this line just watching the tape and comparing like I started out saying, just noticing the moves in the market compared to Tesla. And on day two, Tesla was just
[15:45] noticeably stronger than the market. And this is the day that it came up to and tested the breakout level, which is that pink line. So strong off the open and they were both kind of strong but Tesla was stronger and especially in that
[15:57] follow through the market didn't even move and that relative strength lines making new highs and so that's just like to show how this line works. Um, but
[16:09] when we're trading this, we're thinking, man, like Tesla's over the course of the last two days has shown so much consistent relative strength that this really could be ready to break out. >> It's cool seeing the relative relativity
[16:24] models in the past. Uh, but it's cool seeing it. Just to mention too, if you don't have the relativity line, like one way of also just qualitatively looking
[16:36] at it is Tesla's able to take out its morning high um in the afternoon when Q's never did. That's another small little tidbit you can use. >> like you were just saying. >> Absolutely. Right. And those are those
[16:50] we're mostly using. Like we're not really looking at this line too often. >> and you could even look at just ATRs up as well as other ways to measure hidden relative strength, >> right? Like ATRs up on the day.
[17:04] >> Yeah. >> Yep. Yeah. Absolutely. this? So, I I I'm seeing it on the chart. It's pretty cool to see. And then chart. It's pretty cool to see. And then I'm seeing that at the end of day two,
[17:18] day two is where all the magic happens here. That relativity line starts to really jump. And if you're like a technical trader just trading the relativity, it breaks out then. >> Yeah, it starts to break out and then
[17:31] into the the actual. >> Oh, okay. I see where it >> it gets a perk at the end. >> It's hard to see where it cuts off, but yes, it does. it makes new highs into into the close
[17:45] because the Q's had a pretty >> I think a you know pretty big down move especially um I can't see I can't see if that's at the close or at the open but but yeah basically you want to just see your stock outperforming right and and I
[17:59] your stock outperforming right and and I want to show a example of SNDK which is that recent breakout on a daily chart because that's really where it's kind of fun to see because the reason I grabbed this example Tim was because I
[18:12] remember talking about the relative getting us to get involved in the trade anticipating this breakout. Um just just the at the indicator but I wanted to kind of pull kind of go back and look at
[18:27] because do you remember talking about this? >> Yeah. >> Yeah. It was literally that on that day two we got involved on that day two because of the relative strength and
[18:41] this just to now bring everything back to the pink line. Last episode we were talking about what are some times when we'll break that rule and it's perfectly broke that rule. >> Right. All right. So Tim SNDK this this
[18:55] was the breakout that occurred earlier this month. This was after after a big run. um one of the strongest stocks in the market, but it paused and it it took a break. So did the market. So on the left we've got SNDK with the relative
[19:10] the cues. This this shows like three months of price action. And to me this was a perfect example of that hidden relative strength that we're talking >> expand on that. >> This relative strength line broke out
[19:25] >> This relative strength line broke out when SNDK was doing nothing. It was just entire >> so much clear. >> Yeah. And and and this is on a daily chart. But just to paint the picture
[19:37] like big run takes a pause, pulls back, has a pretty big down day, experiences a little pocket of relative weakness as it comes off the highs. And they often do that, right? Um they'll often first show relative weakness as they consolidate
[19:51] and then they start to hold and then they start to show relative strength and line starts to turn up. halfway through that consolidation and it starts to get a little bit tighter
[20:04] and then that relative strength line breaks out during and I put a little box around the red day little little kind of dogee type red day before that that sort of breakout candle there >> where the relative strength line breaks
[20:18] out and that's because if you look over on the right I put a rectangle around the candle in the Q's that occurred on and the Q's had a big down today. >> So, we had a big down day that closed at the lows in the market and SNDK barely
[20:35] budged. And so, that's like that's the perfect example to me of like that like, "Wait a second. >> SNDK is just holding the 10day here getting tighter and tighter and it couldn't go down with the market. The
[20:49] market had a huge sell day. Something's going on, right? like there's a there's a hidden bid in here and so we might be getting a lot closer to the breakout and then of course like we got a big day the next day and then a nice consolidation
[21:03] Tesla levels Tesla level and breaks out. >> That's so interesting. So we gave two good example like the Tesla was a stock that was strong stronger than the market
[21:16] you're saying the hidden relative strength where it's not green on the strength where it's not green on the day. It's just holding up a lot better. But yeah, when I was even saying the Tesla relativity line broke out, this is
[21:29] such a good breakout in relativity on that bottom left chart. Like that's so like first of all you're you're looking at this for other reasons. Like you're looking at this breakout because it's overall one of the strongest stocks in
[21:43] it's in a great sector and there's a theme surrounding it and it's going sideways and holding the 10day. Like you might have all of these reasons, but this is this is what I mean about like you've got a stock that
[21:57] you're watching and you're just trying to time it and gain clues to how close we are to the breakout. And you might use some of this hidden relative strength to just give you clues as to how close we're getting, right? Right.
[22:11] And not to even forget also like insane the run it had in 2025 and for it to consolidate that um in that upper percentile of the range is crazy. >> Talk about a high tight flag like playbook that mark it up. That's
[22:26] >> right? Yeah. Absolutely. Absolutely. And so it's it's a nice it's a nice little example of like, hey, you know, it's it's not the kind of moment that you're going to get if you're screening for
[22:41] I'm sure there were stronger stocks than SNDK on this day, >> right? But oh yeah, like it wasn't even green. I think it was like a little red candle, but it was way stronger than the market. So if you're watching SNDK and
[22:56] very interested in this breakout then it can be really good information for you. And so I think that like you know one thing you can do is like we like what's your favorite way to look at this Tim? Let me ask you because I know like we're
[23:11] not really looking at this relative strength line when we're trading like we've used this on the quant side. We've kind of developed it for other reasons for scanners and different things like that. But um when we're when you're
[23:24] are you thinking about relative strength? >> Yeah, we mentioned it in general in the beginning like as just a scanner but I find it the most powerful when you are looking for a trade. So again stock
[23:39] selection is very important. where like we're watching SNDK for all those reasons and it's below the breakout level and you're looking just to see if there's any hints that this thing is getting bought and institutions are
[23:54] buying because at the end of the day like what I try to lean back on is that we are trying to follow big money like that's how you catch explosive moves and for me yeah that's exactly what it is. It's interesting too, like there were
[24:08] other reasons for this SNDK to be watching. Like I remember it was so hard there's that Samsung raising their prices overnight catalyst. Um it happened right after um this down day and that was that small gap up into the
[24:24] and that was that small gap up into the next day. So for me, it wouldn't have been that you have to get involved. Actually, I want to make this point too. You don't have to get involved right when you find hidden relative strength
[24:37] that day at all. >> Exactly right. Because you want to wait >> Exactly right. Because you want to wait until usually the market turns up or just like there is a breakout where like it hidden relative strength could last
[24:51] longer than just one day and it doesn't mean that this has to go but it means if the market does reclaim and start trending higher this thing's going to >> Exactly. So, it's like an alert. And that I'm so glad you brought that up
[25:05] Like, it's not like I'm buying it on that little red day just because I saw hidden relative strength. But when I get that alert, however, I'm getting it now,
[25:18] list the next day. And that's like really valuable because now we're watching it even closer because we're thinking like maybe it's it's just getting closer to the breakout. And so I think sometimes those things are like
[25:31] undervalued because like we're always talking about entries and like how you good trade and all that kind of stuff, but like how's it get to the top of your watch list in the first place is a really important factor in trading.
[25:48] That's actually like I kind of wish I even put said that for my answer, but that's really what this is like. It's just a way of ranking your watch list
[26:00] and in turn that's how you catch these huge breakout trades. >> Right. Absolutely. Right. You you start watching like earlier on in this move it like yeah I think it's going to break out at some point.
[26:13] >> Yeah. It starts to get tighter and you're like you know what like this is track. And then as soon as you see that hidden relative strength and then something happens the next day boom all of a sudden it's like wait a second like
[26:26] this is the top the top thing. So it's just it's one of those pieces to the >> And similarly after it breaks above let me see what price that was like 280 me see what price that was like 280 after it has that next um it it broke
[26:40] out from like a 30 minute consolidation um when it went to 280 had that pause and then it had the pink line breakout. It's funny because then at that point point in terms of your actionable watch list, now SNDK starts moving down
[26:55] because it is already made its move. Like you're late to that move if you're looking to play this, >> right? Yeah. Yeah. I mean, you want to get the tip off early. You want to be prepared for these damn things because
[27:08] they happen fast. So that's kind of the point. It's like how many how many ways can we get to like be hawking the right breakouts because there's probably other break out too. We want to we want to make sure we're watching the right ones.
[27:22] So this is kind of like one of the ways to do it, right? And bandwidth is a like it's one of the harder aspects where you know there's so many stocks moving every know there's so many stocks moving every single day and to really crush and
[27:35] capitalize on trades like you do need to focus and have like a priority watch list where you prioritize like what's the most actionable for your playbook and this is a great way of doing it. >> Yeah, I agree. I it's it's funny to me
[27:50] too like on the bandwidth topic if we wanted to jump for a sec like it what is great about hidden relative strength is that you get the little tips early that
[28:02] okay there's a bid here this thing could break out in a big way when the market reclaims. What's also really hard about it is actually just keeping track of these names and not forgetting that. Okay. Oh, that was really like
[28:17] relatively strong this day and like that aspect of keeping track I find kind of name of the game, >> right? Yeah. You want to you want to have a watch list written down somewhere that's organized systematically
[28:33] that's organized systematically in buckets, right? And like I know a lot of people on our desk will have just purely like what's the relative strength watch list. It's literally a list of names that have exhibited relative
[28:46] strength in this way and that's it. And like maybe they set up, maybe they don't, but that's that's kind of the the the stocks you don't want to lose track of in that respect. I think that's a really good idea,
[29:01] >> a breakout trader. Even talking again about relative strength, it's like it's pretty easy right now to say uh SNDK is relatively strong above 540, right? [laughter] >> Is that relative strength? I mean,
[29:15] >> And it blew it blew out earnings tonight. It's at like where where up this was fun, Tim. I'm glad I'm glad you brought me out of hiding for this because I've been I've been in in bed for like a week and a half with the flu
[29:32] with a with a bottle of uh cough syrup next to me, which I I hate that stuff. Remind me never to take that that stuff next time I get sick. I'm done with >> they got to start making it a better flavor, like just CocaCola or something.
[29:47] Yeah, I've been uh hopping out occasionally as as the metals have been going crazy and and making some trades, but it's it's nice to be part of civilization again. Um >> with silver and gold, talk about your
[30:00] week. >> Yeah. Yeah. I don't know if I would call it that. Um but anyway, this is this has been great. I hope that uh yeah I hope I from this and and you know with this
[30:14] in in Bionic Trader that we're that we're kind of sharing and giving out. So >> on Tuesdays. >> Do you want to sit in on all of our daily and weekly in-house trader meetings? There's no bigger edge retail
[30:29] smbtradingfloor.com to learn more. >> Ask questions in the comments. Um at some point we might look to answer some of those. Uh, but keep asking question in the comments and we'll try to
[30:41] respond. And we're again still on Spotify if that's your preferred way of >> And yeah, this was fun. >> All right, until next time, trade well. >> All right, until next time, trade well. See you next week.


⚡ Saved you 0h 31m reading this? Transcribe any YouTube video for free — no signup needed.