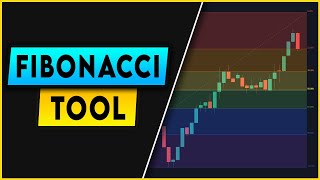

Fibonacci in Nature & Trading
45sOpens with a visually engaging concept of Fibonacci in nature, instantly connecting with viewers' curiosity before diving into trading.
▶ Play Clip"Delivers solid, actionable content on Fibonacci retracements, but the title overpromises with 'exactly how' while the video includes some filler and a plug for another video."
This video explains how to use the Fibonacci retracement tool in trading to identify potential reversal points during pullbacks. The creator demonstrates correct settings, common mistakes, and a full trade example with profit-taking strategies.
The Fibonacci sequence appears in nature (flower petals, shells, galaxies) and can be applied to trading charts to predict pullback reversals.
Fibonacci retracements help find reversal levels when there are no previous support/resistance levels, providing a guide for potential bounce points.
The Fibonacci tool predicted the exact bottom of the S&P 500 crash during the COVID-19 pandemic.
Uncheck 0.382 and all levels after 1, uncheck background and prices, change levels to percents, and set labels from left to right for a clean chart.
Traders often drag the Fibonacci tool from the candle's body instead of the wick. Always drag from the swing low's wick to the swing high's wick for accuracy.
With the recommended settings, there are six levels. The 0% is the start, and the other five are pullback levels. The most common reversal levels are 23.60%, 50%, and 61.80% (the 'golden zone').
If price bounces off any Fibonacci line, it's a pullback. If it breaks below the 100% line, it's likely a downtrend, and price may fall significantly.
Fibonacci levels are not exact; they are areas. Price may dip slightly below a line and still reverse, so treat them as guides, not precise measurements.
After identifying an uptrend, drag Fibonacci from swing low to swing high. Wait for price to respect a level (e.g., 23.60%) and confirm with upward candles before entering.
Sell half the position at the 0% level to lock in profit, then keep the rest for potential further gains. Raise stop loss after confirmation of a breakout.
Never enter just because price hits a Fibonacci level. Always wait for confirmation (e.g., a rejection candle or a series of candles moving in the expected direction).
In a downtrend, price respected the 23.60% level and reversed. Enter short after confirmation, and sell percentages at each level hit (e.g., 25% at 50%, 25% at 61.80%, etc.).
When a Fibonacci level aligns with a strong daily support/resistance, the level is more likely to hold. This increases the probability of a reversal.
Treat levels as areas, always wait for confirmation, sell percentages at each level, and look for confluence with daily support/resistance.
Fibonacci retracements are a powerful tool for identifying pullback reversal points, but they require patience and confirmation. By using the correct settings, avoiding common mistakes, and managing profits systematically, traders can improve their edge.
What is the Fibonacci sequence?
Each number is the sum of the two numbers before it.
00:12
What are the most common Fibonacci retracement levels?
23.60%, 50%, and 61.80% (the 'golden zone').
03:59
What is the common mistake when dragging the Fibonacci tool?
Dragging from the candle's body instead of the wick.
03:13
What does it mean if price breaks below the 100% line?
It's likely a downtrend, and price may fall significantly.
04:14
How should Fibonacci levels be treated?
As areas, not solid lines; price may dip slightly below and still reverse.
04:46
What is the recommended profit-taking strategy?
Sell a percentage of the position at each level hit (e.g., 50% at 0%, 25% at each subsequent level).
09:33
Why is confirmation important before entering a trade?
Price may hit a level but not respect it; confirmation (e.g., rejection candles) increases the probability of a reversal.
07:39
S&P 500 Crash Prediction
Demonstrates the tool's real-world predictive power during a major market event.
02:06Wick vs Body Mistake
A common error that can skew all levels; correcting it improves accuracy.
03:13Levels as Areas
Emphasizes a key principle for realistic expectations and better decision-making.
04:46Scale-Out Profit-Taking
A practical risk-management technique to lock in gains while letting winners run.
09:33Confluence with Support
Combining Fibonacci with key levels increases probability—a core edge for traders.
10:53[00:00] The Fibonacci Sequence. Seen in many forms of nature all around the world. Flower petals, shells, galaxies, hurricanes, and even faces. So it's seen all around in nature.
[00:12] But can we use it in trading to help predict markets? The Fibonacci Sequence starts like this. Each number is the sum of the two numbers before that. It's a simple pattern, but it appears to be
[00:24] a kind of built-in numbering system in nature. And it's one of the reasons why charts look like this. creating higher highs and higher lows. So can we use this tool to help find a specific spot
[00:37] where a pullback has a high chance of bouncing off and creating a new higher high? Yes. And I'm going to tell you exactly how to use the Fibonacci retracement tool the right way, what a common mistake people make while using it, and show you how to exit your trades correctly so you can get
[00:52] the most profit as possible. Let's get straight to it. So what are Fibonacci Retracements? They are key levels from the Fibonacci Retracement tool that can help you find the reversal of a pullback. Let me show
[01:07] you a great example of when to use these levels. A lot of traders like to wait and trade off a pullback considering 1. it's usually at a cheap and great price and 2. it's usually a place where change in price will happen. This is usually how a
[01:22] normal trade would go. You see an uptrend, you also notice there's a key level acting as both a support and resistance. So you now know if the price does end up making a pullback at that level, there's a great chance of it bouncing off and creating a new higher high, making this spot
[01:38] a great level to buy if it shows confirmation. But what if you were in a position like this, where the price went up and made a pullback, but there weren't any previous key levels of support or resistance. How do you know where the key levels are for a reversal to happen? The answer?
[01:54] The Fibonacci retracement tool. If we plot these levels you can see the price respected them and actually use these levels as a key support. Another great example of the Fibonacci's magic
[02:06] is the S&P 500. If we go back when corona hit you can see the Fibonacci tool predicted the exact bottom for the crash. Let's go over the best settings for this tool. To do that get on trading
[02:18] view. If you don't have it, I'll leave a link in the description. Next, click on this icon right here. Make sure it's on the Fibonacci retracement. Just place it anywhere on the chart and click the settings icon. What we want to do is uncheck 0.382 and then uncheck all the other boxes after 1.
[02:36] Next, uncheck the background. I know the colors are fancy and cool, but this mostly just makes your chart messy. Then, uncheck prices and change the levels from values to percents. Also, change your labels from left to right.
[02:49] These are the settings that I found work best for me, and it makes it really clean on the chart. So now that we have the correct settings, let's move on to how to use the tool correctly. First things first we need to find a clear trend In this example you can see a clear trend with a swing high and a swing low The next step is to drag your Fibonacci retracement tool from the swing low to the swing high One common mistake that I
[03:13] see a lot of traders making is that they drag from the candle's body rather than the candle's wick. The price didn't stop here. Sure it might have ended up here, but this was not the highest it went. So when making your Fibonacci levels make sure
[03:27] you're going all the way to the width. So once you have dragged your Fibonacci retracement tool from the swing low to the swing high, it's time to understand how to read these levels. So with my specific settings, you're going to have six levels. The 0% level is basically your starting point.
[03:43] The other five levels are your pullback levels, meaning that if price hits one of these levels and respects it and starts reversing, it's very likely that it'll go up to the next highest level or even higher. The most common levels you'll see this happen with are these three levels,
[03:59] 23.60, 50, and 61.80. A lot of traders will call this area the golden zone. This tool will also tell us what is considered a pullback. If the price bounces off any of these lines, it's considered a
[04:14] pullback, meaning there's a chance for it to bounce off and go to the next level. If the price breaks below the 100 line, it'll likely try to come back and fall, starting a downtrend. To be clear, anything above the 100 line is a pullback. Anything below the 100 line is not a pullback
[04:30] and is a downtrend. So it's important to note, if the price ever goes below your 100 line, it's pretty likely it'll fall a lot more after that. You should also understand that you need to treat these levels just as you would for support and resistance. They are not solid lines,
[04:46] fair areas. Meaning, the price is not always going to respect the exact level where the line is. Just because the price falls below a line doesn't necessarily mean it has broken that area. It could
[04:59] still reverse from this point. So, I guess what I'm trying to say is don't treat these levels as an exact measurement. You should just be treating them as a guide. How do you know which level the price will reverse at? Well, how about I show you an example. So, here we found a clear trend
[05:14] upward. We identify the swing low and the swing high of the trend. Next, we select our Fibonacci retracement tool, and we drag from the swing low's wick to the swing high's wick. Next, we see what price does. We see the price retested the 0% level, but just as I said before, just because
[05:32] price breaks through a level doesn't necessarily mean it's certain. So, as you can see, it tested the level and got rejected. It ended up doing that two more times, telling us that it really wanted to go above this level. Next we see it come down to the 23.60 level and look how much
[05:49] it's respecting this line. Once I see this candle right here I'm probably entering the trade because I can be pretty certain the price will go up from here as a pullback or at least go to the 0% level.
[06:01] It also very important to get confirmation Just because price is respecting the line doesn necessarily mean it going to go up So once you get the respect make sure you have some candles going upwards to confirm that respect
[06:14] So after I see some confirmation, I enter the trade and set my stop loss right below the 23.60 line. And then I'm going to sell half my shares at the 0% line. Let's see what the price does.
[06:26] It turns out we were right and the price went up to the 0% line, giving us a nice little profit. So, we sell half our shares, so we guarantee that profit. But, we are not done. As I said before, prices tried breaking through this line multiple times, telling us it really
[06:43] wanted to go up from here. So that's why we're keeping half our shares in the game. We see that price breaks through this level and comes back down and respects it. This right here is like seeing gold on your screen.
[06:55] The price broke through, made a slight pullback, and respected the highest level. meaning it's about to make a big move upwards. After I see a bit of confirmation, I raise my stop loss right below the 0% level,
[07:08] then look what happens. The price skyrockets. So as a quick overview, let's go over some key moments of this trade. There were multiple times price tried breaking through the 0% line, but we never entered at these points because there was never any confirmation of it going up.
[07:24] Another key point is when the price went down to the 23.60 level, we only entered after seeing the price respected this line and gave us confirmation it was going up. Just because price hits a line doesn't mean it'll respect it.
[07:39] You should always be looking for confirmation. It's a very important concept to understand when using the Fibonacci retracement tool. Here's another great example that'll help you understand the Fibonacci so much better.
[07:51] We found a clear trend upwards. We identified the swing low and the swing high. We made sure to put our levels all the way to the wicks. then we wait and see what price does. We see that price slightly respects this level by one candle
[08:04] resisting it, but probably not enough information to enter the trade yet. Then the price tries to break through the zero line and then comes and reverses back to the 23.60 line. We then see a
[08:16] candle appear not even thinking about respecting this line at all, breaking right through it. This right here might be a good spot to enter a short, but you probably need a bit more confirmation, So, we wait. We see it kind of bounce off the 50 line and then hits it again going right through it.
[08:33] Then, the price consolidates in this area not knowing what it wants to do. Whenever price consolidates like this, price can go in either direction. The market doesn't know what it wants to do and it's usually a pretty risky spot.
[08:46] So, it's usually not a good time to enter a trade at this moment. It ends up breaking upwards going all the way to the 23.60 line again but then gets rejected. After seeing this confirmation candle, this would be a pretty nice place to enter a short trade,
[09:01] considering the price is respecting this resistance. And last time this happened, it went down to the 61 line We see price goes back down to where it did before and does another one of those reversals going back to the 23 line and respecting it another time
[09:19] So if you missed going in the time before this, this is an absolute great time to enter a short trade as well. So now that we are for sure in the trade now, I should also mention that you should be selling a percentage of your trade for each level that gets hit.
[09:33] The important rule is get the profit confirmation. It's a very important rule and it's critical to become a profitable trader. So what does price do? It drops back down to the 50% line. It sort of respects it, but it's still kind of unsure.
[09:47] We still sell around 25% of our shares at this level for guaranteed profit. Next, we see a monster of a candle break through the 61.80 line. The next couple of candles start respecting this line.
[10:00] We sell another 25% of our original entry and we see what price does. It goes up breaking through the 61.80 line and doesn't quite make it to the 50 line. After losing momentum, it drops back down to the 78.60 line.
[10:16] So we now know this 78.60 line is a pretty strong support, considering the price keeps stopping right around here. So we know if the price ever breaks through this point, it's going to drop hard.
[10:28] And look what happens. Price breaks through it, making it go all the way down below the 100 level. We sell another 25% of our original entry and keep the last of the money in the trade for a high return gain.
[10:41] We've now made a really good profit and all that profit is confirmed. And we are even still in the trade. And look what happens. The price breaks through, comes back up to the 100 level, starts resisting.
[10:53] This right here is that gold moment I was talking about before. After seeing this, we have a pretty good idea the price will drop a lot. And look what happens. Price drops. Another key tip that'll help you guys out so much is if you ever find a Fibonacci level where it matches up with a key level of support, like this example, the white line with Play Steer, it gives us a key support level on the daily time frame.
[11:17] Then we have the green 50% line from the Fibonacci retracement tool right under the strong daily support. This means that this level right here is very likely to be a strong support or resistance.
[11:29] And as you can see, the price did exactly that and treated this area as a strong support. So some key takeaways. You should be treating your Fibonacci levels as areas, not solid lines.
[11:41] Always wait for confirmation before entering a trade. Sell percentages of your position for every level that is hit. If you find an area with a strong daily support and a Fibonacci level, there's a great chance price will respect that level.
[11:55] If you want to use the Fibonacci retracement tool to grow a small size stock account, watch this video. Because I go over the best ways to grow a stock account with a small balance efficiently as possible.
[12:07] Thanks for watching and I'll see you guys next time.



⚡ Saved you 0h 12m reading this? Transcribe any YouTube video for free — no signup needed.