

The One Fibonacci Setup That Actually Works
45sPromises a unique, proven Fibonacci strategy that stands out from common trading advice.
▶ Play Clip"Delivers a concrete, testable setup with backtest results, but the '80% win rate' headline is based on a tiny sample and could mislead."
This video presents a specific trading setup that combines Fibonacci retracements with hidden RSI divergences to identify continuation trades. The creator explains the logic behind the setup, demonstrates how to define entry, stop loss, and take profit levels using Fibonacci, and shares results from backtesting the strategy as an automated TradingView indicator.
The video introduces Fibonacci extensions as an alternative to closing at the impulse end. The creator mentions using Fibonacci retracements for a long time and testing various combinations, but focuses on one simple setup.
Most traders don't know which retracement level is worth trading or where to draw the Fibonacci tool. Drawing it on any move will eventually see price touch a level, but that doesn't guarantee a trade.
The specific thing that changes the setup is a hidden RSI divergence occurring at the 61.8% retracement. This is a continuation signal, not a reversal signal.
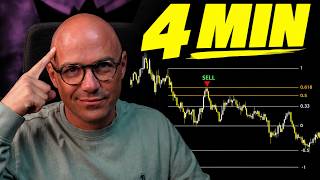
The Fibonacci tool is drawn from the beginning of an impulse move to its end. The level of interest is the 0.618 retracement.
A bullish hidden divergence occurs when price makes a higher low while RSI makes a lower low. This indicates a continuation of the existing trend, not a reversal.
The setup requires: an existing bullish impulse, a higher low (bullish structure intact), a retracement to the 61.8% level, and an RSI lower low (hidden divergence). Entry is at the 61.8% retracement.
Stop loss is placed at the beginning of the impulse (if price returns there, the thesis is invalid). Initial take profit is at the end of the impulse. This defines the entire trade using the same move.
The creator coded the rules into a TradingView indicator to automatically find setups. Visual backtesting looked excellent, but to avoid bias, it was converted into a strategy for mechanical execution.
Initial tests showed a 48% win rate. Separating directions revealed that short setups massively outperformed longs, so the strategy was switched to shorts only, boosting the win rate to 64%.
Changing the take profit to a Fibonacci extension (instead of the impulse end) resulted in an 80% win rate and a profit factor of 8, but this was based on only 10 trades, which is insufficient data.
Pushing the target to the full -1 Fibonacci extension caused the win rate to drop to 36%, showing that this extreme target is not realistic and highlighting the danger of overfitting.
The creator advises viewers to backtest continuation trades and train their eyes to identify hidden divergences. The trend is your friend, and trading with it is like buying a PlayStation 5 at a 61.8% discount.
The video presents a specific, rule-based trading setup combining Fibonacci retracements and hidden RSI divergences for continuation trades. While initial backtests show promising results, especially for shorts with Fibonacci extension targets, the creator cautions against overfitting and emphasizes the importance of understanding the underlying concepts.
What is a bullish hidden RSI divergence?
Price makes a higher low while the RSI makes a lower low, indicating a continuation of the uptrend.
02:24
What is the key Fibonacci level used in this setup?
The 0.618 retracement level.
01:39
Where is the stop loss placed in this setup?
At the beginning of the original impulse move.
04:04
What was the win rate for shorts only when targeting the Fibonacci extension?
80% (8 out of 10 trades).
06:50
What is the main difference between a normal divergence and a hidden divergence?
Normal divergence predicts a reversal, while hidden divergence signals a continuation of the trend.
02:40
What happened when the take profit was pushed to the full -1 Fibonacci extension?
The win rate dropped to 36%, indicating the target was too aggressive.
07:39
Hidden Divergence as the Key
This is the core insight that differentiates this setup from simply trading Fibonacci levels.
01:11Combining Two Concepts
The synergy between Fibonacci retracements and hidden divergence creates a high-probability continuation setup.
03:09Backtest Results
The 80% win rate with a profit factor of 8 is striking, but the small sample size is a critical caveat.
06:50Overfitting Warning
The drop in win rate at the extreme target illustrates the danger of curve-fitting to historical data.
07:39PlayStation Analogy
A memorable analogy that explains the psychological appeal of buying a retracement in an uptrend.
08:42[00:00] But Fibonacci doesn't stop there. We have Fibonacci extensions. So instead of closing here, what if we target one of the Fibonacci extensions? So I changed one setting, I ran it again, and I've been using Fibonacci retracements
[00:14] for probably longer than almost any other tool in my trading arsenal. And over the years, I've tested literally every single combination you can trade them. The 38.2, the 50, the 61.8, the Fibonacci extensions, confluences, trend lines, moving averages, all of it.
[00:32] And if I had to delete everything I've learned about Fibonacci and keep one simple setup, it would be the one that I'm going to show you in this video. Because the biggest problem with Fibonacci isn't Fibonacci itself.
[00:44] It's that most traders have absolutely no idea which retracement is actually worth trading. Not to mention they don't know where to draw the Fibonacci retracement from and to. You can draw the Fibonacci retracement on almost any move,
[00:58] and eventually price is going to touch one of these levels. It doesn't mean that there's a trade there, but there's one specific thing I found that can happen at the 618 retracement that completely changes how I look at the setup.
[01:11] That one thing is a hidden RSI divergence. Now don't worry if you have no idea what that means, because in about two minutes, this is going to make complete sense. Let's start with the Fibonacci side.
[01:23] Let's say price makes a move like this. We have a clear low, price pushes higher, and then we get a retracement. I take my Fibonacci tool from the beginning of that move to the end of the move, and the level that I'm interested in is right here, the 0.618.
[01:39] Now, normally, a trader sees price hit the 0.618 and thinks, Okay, buy. I don't. Because there's nothing stopping price from doing this. The Fibonacci level is not in itself enough confluence to enter the trade. I want price to give me another piece
[01:55] of information. And this is where the setup gets interesting. Most traders who know RSI divergence know the normal version. Price makes a lower low while the RSI makes a higher low. That's a bullish
[02:07] divergence. But that's not what we're looking for. We're looking for something called a hidden divergence and is basically the opposite. Watch this. Price makes a low, it rallies, then pulls back. But the second low stays higher than the previous low. That's important.
[02:24] Price is telling us we still structurally bullish Now look at the RSI Instead of RSI making a higher low the RSI makes a lower low So price makes a higher low and RSI makes a lower low That is a bullish hidden divergence And the
[02:40] hidden divergence is different from normal divergences because we're not trying to predict a reversal. We're looking for a continuation. Price has already moved up. It pulls back. Momentum gets washed out, but price refuses to make a new low.
[02:55] And now here's where these two completely separate ideologies in trading come together. What happens if the hidden divergence occurs right at the 61.8 Fibonacci retracement? Now we have something completely different.
[03:09] We have an existing bullish impulse. We have a higher low, so the bullish structure hasn't been broken. We've retraced roughly 61.8% of the original impulse move, and RSI has made a lower low.
[03:23] That's the setup. And that's basically all we're looking for. Impulse, retracement, 61.8. Price made that higher low. RSI makes a lower low.
[03:35] Enter a buy. And obviously this works in reverse as well. For a sell, price moves down. It retraces back up to the 61.8. price makes a lower high while the RSI makes a higher high, that's a bearish hidden divergence.
[03:49] And we're looking for the continuation back down. Once you understand what you're looking for, these setups become ridiculously easy to see. But then I had another question. Where the hell do you put the stop loss and the take profit? And this is where Fibonacci gives us the entire trade.
[04:04] Let's use this short setup because it's incredibly easy to visualize. You can see the original impulse from top to bottom. Price retraces approximately 61.8%. We get a bearish hidden divergence. So our entry is around the 0.618 retracement. Our stop loss goes back here at
[04:22] the beginning of the impulse. Why is that? Because if price gets all the way back up here, the ideal we're trading is basically failed. The original hypothesis is null and void. And initially, my take profit was extremely simple at the bottom of the original impulse. So the entire trade is
[04:38] defined by the same move. Impulse start equals the stop loss, 618 retracement is your entry, and the impulse end is your target. Not a random 20 pip stop or a 10 pip stop, no arbitrary two to one risk to reward ratio.
[04:52] The market structure determines everything. But while I was building this video, I started wondering what happens if we use Fibonacci for the target too And that where things got a little bit ridiculous because obviously I can sit here and cherry beautiful examples all day That proves absolutely nothing So
[05:08] instead I coded the rules and I turned the entire thing into an indicator. It automatically looks for hidden RSI divergences occurring around the 61.8 retracement and then it finds one. It marks up the setup. So here is a bearish
[05:21] example and here's a bullish one. And then when I put this up on the chart I I genuinely thought something was screwed up because I started scrolling backwards and these setups looked really fucking good. One winner, another, another, another.
[05:33] I kept scrolling and I could barely find a loser. Now, obviously, that's where you have to stop yourself because visually scrolling through the chart is probably one of the easiest ways to convince yourself you've invented the holy grail. So I converted the indicator into an actual TradingView strategy.
[05:47] Now TradingView has to execute every single signal mechanically. No cherry picking. None of that, oh, I probably wouldn't have taken this one because blah, blah, blah. If the condition exists, it trades it.
[05:59] And here's where the experiment went into somewhere that I wasn't expecting. Initially, I tested both buys and sells, and the results weren't amazing. It's around a 48% win rate. Profitable, but nothing crazy.
[06:11] Then I separated the two directions, and something immediately jumped out. Short setups were massively outperforming the longs in this particular setup. So I switched the indicator to do shorts only. Same setup, same entry, same stop, nothing changed.
[06:25] And the win rate roughly jumped to 64%. That got my attention. But then I started playing with the take profit. Remember, originally, our take profit point was at the end of the impulse move. But Fibonacci doesn't stop there.
[06:38] We have Fibonacci extensions. So instead of closing here, what if we target one of the Fibonacci extensions? So I changed one setting. I ran it again. and I got an 80% win rate.
[06:50] Eight winners and two losers. Profit factor, eight. Now, before somebody takes that information, starts clipping it and selling their own course, there's a gigantic problem here. It was only 10 trades.
[07:03] That is nowhere near enough data for me to tell you that this is an 80% win rate strategy. So just to clarify, I'm not saying that it's good. In fact, if I kept tuning settings until I found the prettiest back desk possible,
[07:15] I'd probably be overfitting the strategy. But something else happened that I thought was really interesting. I pushed the target slightly further, and I tested it even further through the Nachi extension. Same stop same trades I didn touch anything Same win rate 8 out of 10 But now we extracting more funds from a functional better larger take profit giving us a higher profit factor
[07:39] And then I went to the extreme and pushed it out to a full minus one Fibonacci extension. And finally, the strategy broke down. The win rate dropped to like 36%. And I actually love that result because it shows that the consistency of that full Fibonacci extension
[07:57] is not realistic. It's kind of the overshoot a logical target fallacy. But what I'd like you to do in the meantime, while I keep developing this, is go on your chart and backtest continuation
[08:11] trades. Start training your eyes to identify hidden divergences. Hidden divergences are continuations. And one of the number one rules of trading that has never changed ever since the
[08:25] beginning of time is the fact that the trend is your friend. If you are trading with the trend, you are swimming with the current. You're not fighting the opposite side of the market. And it's the most easy way for me to explain trading in an analogy. Let's say a PlayStation 5 is $500
[08:42] and then it goes on sale 61.8%. That makes that PlayStation $191. And you cannot tell me that everybody on planet Earth who wants a PlayStation 5 would not buy one for $191. That's the psychology
[09:00] of it. Price rips up, too expensive, price comes back down. Wow, that's a slamming deal. Buy, price continues. The thing that I want you to focus on the most is actually doing this,
[09:13] because it would be pointless for you to sit down and create your own indicator if you do not know what you're looking for. If you can't personally identify it yourself, you can't train an AI to
[09:27] write the script for you, and you can't write it yourself unless you have these concrete rules. And this is going to make you a much better trader because you're seeing the subtext of what
[09:40] price movement is telling you. It's called a hidden divergence for a reason. Fucking hard to If you guys enjoyed this video and you want to see more videos about Fibonacci, let me know in the comment section down below.
[09:53] Thank you so much for watching. Make sure to share this video with your friends, and we will see you in the next one.



⚡ Saved you 0h 10m reading this? Transcribe any YouTube video for free — no signup needed.