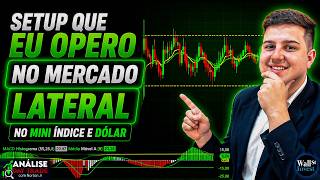

Why Most Traders Fail in Sideways Markets
44sHighlights a common trader frustration and promises a solution, sparking curiosity and engagement.
▶ Play Clip"Title accurately promises sideways market setups; video delivers two specific strategies with real examples."
This video explains how to trade in sideways markets, using the Brazilian mini-index and dollar as examples. The presenter shares two specific strategies—the slow stochastic oscillator and average deviation from a moving average—to profit when the market lacks a clear trend. Statistical data shows that 55-60% of trading days are sideways, making these strategies essential for consistent profitability.
55-60% of trading days are sideways (range 1500-2500 points), while only 20-25% are trending days. High volatility news days account for less than 5%.
No major news; market sideways. Banks falling (Itaú -1.5%, Banco do Brasil -2%), Petrobras rising 2% on oil price increase (+3.3% due to US-Iran tensions).
Use slow stochastic (0-100). Above 80 = overbought (sell signal), below 20 = oversold (buy signal). Works well in sideways markets for mean reversion.
On sideways days without news, price typically stays 100-120 points from the 6-period exponential moving average. When deviation reaches 100-120 points, enter against the trend (scalp). Stop loss above/below the moving average.
Traditional moving average crossovers work better abroad (S&P 500, Nasdaq) due to stronger trends. For Nasdaq, use shifted moving averages for faster scalping.
Traders must adapt to sideways markets, which dominate most trading days. Using stochastic oscillators or average deviation strategies can turn low-volatility periods into profitable opportunities.
What percentage of trading days are sideways according to the video?
55-60% of trading days are sideways.
03:54
What are the two strategies recommended for sideways markets?
Slow stochastic oscillator and average deviation from a moving average.
08:16
What does a slow stochastic reading above 80 indicate?
Overbought condition, suggesting price may fall.
08:16
What does a slow stochastic reading below 20 indicate?
Oversold condition, suggesting price may rise.
08:31
On sideways days without news, how far does price typically deviate from the 6-period EMA?
100 to 120 points.
09:39
What is the recommended stop loss placement for the average deviation strategy?
Above the moving average for short trades, below for long trades.
12:08
What risk-reward ratio does the presenter suggest for the average deviation strategy?
1:1 proportional stop loss.
12:08
Which moving average periods does the presenter use for trend trading?
6 and 20 periods (6.20).
08:01
What is the typical range of a sideways day in the Ibovespa?
1500 to 2500 points between low and high.
03:54
What percentage of days are trending days?
20-25% (4 to 5 days per month).
03:54
Sideways Market Statistics
Provides concrete data that 55-60% of trading days are sideways, emphasizing the need for specific strategies.
03:54Slow Stochastic for Sideways Markets
Introduces a clear, rule-based method for mean reversion in range-bound markets.
08:16Average Deviation Strategy
Offers a precise entry trigger (100-120 points from EMA) for scalping in low-volatility conditions.
09:39International Market Differences
Highlights that moving average crossovers work better abroad due to stronger trends, aiding strategy selection.
16:16[00:02] throughout the month the market moves sideways? So, a trader who doesn't like trading in a sideways market needs to know that it's a sideways market that day and not trade on that day. If he doesn't like it or doesn't know how to operate it. But a trader who
[00:14] adapts and can also operate in trending markets and has a setup to operate in strategy, you do very well. That's why in this video I'm going to show you two strategies, okay? So you can operate in a sideways market, like
[00:28] today. Today was a day with practically no news. The market is abroad, in the United States and Europe in general. And in today's market, many favor of the trend, whether using inside bars or moving average crossovers,
[00:44] ended up doing a bit poorly at the beginning of the day because the market was crossing, uncrossing, entering, exiting, entering, exiting all the time. So this ended up hurting the revenue a lot. For those who don't know about sideways trading,
[00:56] sideways markets because I lacked confidence and relied heavily on moving average crossovers. I hadn't tested other strategies and didn't know how to adapt, This was great because it prevented me from
[01:10] develops and it becomes possible to configure sideways market strategies strategy that will allow you to trade. Today Nint is practically at 0, down 0.02%, or 0.2% at this moment, and Dor is up
[01:24] more or less 0.15%, 15%. Vale is also at breakeven, but what's drawing attention is the rise in Petrobras shares, which are up around 2%, plus another 2.30%, driven by the rise in oil prices, up 3.3% at the moment in
[01:39] oil prices, up 3.3% at the moment in England, because between yesterday and today the United States sent several refueling planes in flight, possibly anticipating an attack with missiles or fighter jets in Iran. This
[01:52] ended up significantly hindering the stock market's performance throughout the day. That's why banks are falling quite a bit here in Brazil these days. Itaú, Banco do quite a bit here in Brazil these days. Itaú, Banco do Brasil, BTG, right? Well, Banco do Brasil and
[02:05] shares fell today. Meanwhile, the American market indicates that the SP500 is down 0.6%, and the Nasdaq is down approximately 0.8% . What's striking is that gold is rising 0.5%, 5%, while
[02:19] oil is up 3.5%, the highest price, 86% of the price per barrel, the highest price since the end, in quotes, of their pause, when they started counterattacking again at the beginning of this week, right? Now let's
[02:32] I'm going to show you the statistics for when the market is moving very interesting image for you. If you want to learn how to trade properly, . The link is in the description so you can
[02:45] choose a brokerage firm. Sending money, bringing money, what are the best day. That's what sets Street apart. Besides, besides, okay? Yes, you can count on support directly from me. The live online director's report starts on the 28th
[03:00] immersion group as well. All links are in the description. And my phone is here on the final screen, 400. I'm already at that point, it's for those who are starting out and all that. And the in-person immersion course here in Curitiba. Okay, everyone? So let's get
[03:14] like, comment, subscribe, and turn on notifications so you don't miss anything. Remember, your feedback is the most important thing to me here, and I want critics; suggestions are always very welcome, okay? OK? So let's get to
[03:29] one I made for artificial intelligence to generate. I had this data, but I more didactic and intuitive. If you look here, folks, uh, right here, analyze this graph carefully, what we have here is the
[03:42] Ibovespa, right, at the beginning, typical months and 22 trading days. And I got the statistics between 3 and 4 years, more or less, okay? For about 55% to 60% of the month, the market has a
[03:54] range between 1500 and 2500 points between the low and the high. Days with a clear trend are 4 to 5 days and 20 to 25%. Days of high volatility, which are news days, for example, right? It's less than 5%, for example, Super Wednesday,
[04:08] larger movements, right, of, for example, 3,000 to 4,000 points throughout the month. Sure, it's going to hit months like that, right, with elections, months of attacks from Iran, from the United States, tariffs, and so on, that really changes the market quite a bit, does
[04:23] n't it? Well, that ends up being more days there, but that's an estimate over the last three to four years. Well, the trader, so there are traders who say things like, "North, I don't want to trade in a sideways market." So you'll be trading four to five, up to a maximum of
[04:36] six days a month, which is roughly 25, 20 to 30% of the month. So , right? And on the other days you don't trade, you avoid trading if you don't know how to trade in a sideways market. But if you know how to trade in a sideways market, but don't
[04:49] know how to trade in a trending market, you tend to be a more profitable trader, market stays sideways, as the buying and selling forces are balanced. Like today, for example, right? So here's
[05:01] more about it later, you can pause the video, right? Sideways trading days, market low volume most of the time. Trend days, strong directional movements, uptrend, true breakouts and high volume
[05:15] seen is high volatility without direction, large oscillators, violins, false breakouts, market shaking without trending, without trend and high impact days, news, Super Wednesday and Wednesday days, payow and PCA
[05:28] average behavior, statistics based on and observation of price action and Ibovespa volatility over 3 to 4 years, except for atypical days and news, most 's very interesting that you were able to understand that as well. Before we get into the
[05:42] sideways market setup, let's grab a clean chart here, okay? Well, first we need to understand the context. Today we're going to look at the mini-index, that are part of the mini-index. Bradesco is down 1%, Ital is down 1.5%,
[05:56] Banco do Brasil is down 2%, BTG is down, you can see that the main banks are down today, right? Well, if you take, for example, Petrobras's prices rising due to the increase in oil prices, and rising due to the increase in oil prices, and
[06:11] rising in price, due to the tariff not having affected Embraer. Cupel is going up again after having fallen quite a bit yesterday as well, okay? So folks, that market is trying to move, but it's going to hit this support zone around
[06:24] 174,000 or 175,000 points, and there's hardly a chance of it breaking through soon, right? Sure, there's still plenty of trading time left , but the market is moving sideways, right? Okay, economic calendar, folks, I saw that consumer confidence in the United States came in
[06:38] bad news, because consumers still have confidence to buy, they think this could also lead to increased inflation, okay? So, analyzing the market is quite sideways today, there were some movements and
[06:53] trends, some downward movements throughout the day, right? Hey, and the boingo didn't work out today , okay? There was no entry, neither a buy nor a sell order, on Oingo Boingo, okay? That's why this second candle here, folks, did
[07:06] n't break either the high or the low. Unlike yesterday, when the first candle first candle, triggering a sell signal and easily hitting the stop-loss, at 500 points. Today there wasn't even a game entry and there wasn't even a lot of los because there wasn't an
[07:20] using a cross from midfield. This downward trend he's shown here is an interesting movement; it's a movement that allows you to see a different direction, so to speak. Well, in
[07:34] say that too, okay? So, there was this movement from below here. And for those who use the moving average crossover, it seems that this was the first moment in the trend that was actually interesting for trading using the moving average crossover or even
[07:47] inside bar, for example, okay? It crossed the moving averages here near 1.5, , MACD in red, in the 26 129 configuration, right? It kept hitting the six-period moving average and then going back down. Six and going back, I use 6.20 here. Both
[08:01] use in my day-to-day operations. It pulls back to the average, which is when I go also during a downtrend. But that's not the focus of this video. The trader has to learn how to strategies that operate in a sideways market. The first one is using the
[08:16] slow stochastic oscillator, okay? It oscillates between 0 and 100, right? I even made a video talking about sideways markets. When it's above 80, it indicates that it's overbought, meaning it's reached an excess of purchases and tends to fall, okay? Já é
[08:31] when it's below 20, it indicates that it's oversold, and it tends to move upwards. So, operating the regions works well. Today, during the third period that I use, the stock level has rarely been
[08:44] above 80, right? Very rarely , right? And when his blood sugar went above 80, he wasn't admitted. And when it dropped below 20, he didn't apply either, right? Yeah, he even made a stop here, actually, look. It was below 20 here, near
[08:57] candle 56 at 1:35 PM. When was the customer in stock? 21:24. Forget it, it's over, right? This needs to be very precise. And this one here, how much was this one? This one was at 1 PM, look. This one
[09:10] too, look, at 1:50 PM it was 79.24. So, basically, there was no down payment today Well, Nort, then it didn't work out," I've told you several times , I don't operate. Well, it also depends a lot on you, since it's Friday
[09:24] too, right? This situation needs to be made viable . But, for example, if I take right, which is another indicator that I like to use, that I use on a Then, add an indicator, called average deviation, six periods,
[09:39] exponential, personal. Well, except for days with news, personal. Well, except for days with news, the price usually stays between 110 and 120, 100 to 120 points away from the average.
[09:54] What does that mean? Let's take an example, okay? Candle 17. Candle 17 closed approximately 300 points away from the moving average. About
[10:06] 300 points more or less from the six-period exponential moving average, okay? of the moving average if it becomes exponential. If you look here, folks, the average separation actually captures the entire movement of the candle while it
[10:18] was active, okay? He doesn't catch the closing of the candle. So, in this when the spacing reaches around reaches around 100 to 120, allows you to trade against the
[10:33] trend. Since the market is moving sideways, these are scalping operations, entering and exiting quickly. What does that mean? The average deviation, that the market is moving sideways. Today, all the signs pointed to the market
[10:45] AM there were a lot of wicks, a lot of dojos, a lot of stagnant cenos, about 100 points in the average separation here, which in reality was here, actually a broken scale, okay? 0.12 is 120 points, right? 0.10 equals 100
[11:02] points. Well, when it gets more or less above 010 on lateral days, okay? Forget about the money news, the payroll super quarter, forget about sideline days without news, right? Which is the case today. When does he get to that point of
[11:15] gets to the point of moving around like that, distancing himself like that, what happens in that case? Here's what happened, here's what happened , okay? Well, you're going here, the cashier, the customer actually ended up saying it's showing 180,
[11:29] right? So, things get a little tough. What do you do? You wait for the candle to close, right, or not, it depends a lot on your aggressiveness, but when it 100 points, either above or below the six-period moving average
[11:43] , you enter against it. So, for example, when he scored here, 120 points, it would be more or less here, it would be an entry here. Let me type my password here. It would be an entrance, but it would be more of an
[11:55] type in my password, I made a mistake here. right? But it would be around this time when he was scoring 120 points. You place the stop-loss order above the moving average, right? And for the stop loss, you usually leave a
[12:08] stayed here when the candle closed because the target was here, it was on the previous candle, right? And it positioned itself at a one-to-one proportional stop loss, right? More or less here. So they give me about 250 points when I logged in, right? That
[12:21] look. We've reached a point where there's a medium-level gap here again, look. Further ahead here, 160, but above 120, 110, 120, you can start entering against the movement, which was basically the movement it had here, right? He ended up staying there
[12:35] would be more or less here, your stop game would be above the moving average and the stop loss proportional, right? This one was a , right? But that would be an interesting entry, wouldn't it? It's the same thing here too
[12:48] . He even managed to distance himself from the entry point and the return to the average, okay? This is folks, for a sideways trading day when the trader isn't feeling very confident, right?
[13:00] PM as well. Things just came to a head here, didn't they? Because he got the distance himself, he bought himself, he started falling and caught up in a movement now, right? But up until then, everything was fine, right? It even reached
[13:14] points above average several times , okay everyone? Could this translate to actions? That's possible, right? But I have to change the average distance. I would suggest a shorter moving average, maybe four, right? It also depends on the time frame. If you're
[13:28] average spacing of around 20, right? So it's great that you can example, the dollar, and the mini-index as well, right? The dollar-wise bias is more pronounced, right? So, people end up taking the strongest stop losses there
[13:41] regarding the dollar as well, okay? This could paralyze the international market, the international market to show you the market trends enjoyed this sideways market strategy . And the international market
[13:53] today, folks, hasn't remained as sideways as Brazil's was here, right? That using the Black Air platform, okay everyone? It's free. The link is in the description of the FX Globe brokerage, which is the brokerage I use. If you have a balance
[14:05] of $ or more, the platform becomes completely free. Yesterday I had a you the link to enter the promotion here so you can win the iPhone 17 Pro Max, okay? Let's go, everyone. Well, here we have the SP500 index. Right now
[14:18] it's dropping 0.79. 79% of the time, the downward trend is underway. So, guys, oil, right? So, UK oil is the petroleum branch, right? And at that moment it goes up, let me take, take the indicators here, look, it goes up 3.4%, 86 the
[14:33] since the war resumed in the Middle East, right? Actually, tensions had already started to arise on July 7th, increased the tension, then it went back to $75, it was OK. After Friday night
[14:49] into Saturday morning, the week got much worse, and the worst day of all was Monday the 13th. That's why it worked so hard. It 's rising strongly today too. Like I told you guys yesterday , gold and oil aren't traded
[15:06] volatile trades, the asset goes up and down very quickly. Using, for example, VIP bands on gold and oil, um, I think that's cool. Use a sidebar, a mid-range crossover, something like that. The S&P 500 is down 0.8%, it was worse today,
[15:21] actually it improved quite a bit. If we look at the stocks that make up the São Paulo index, the main ones, they all fall. Apple falls, Amazon falls, Google falls, Meta falls, Microsoft falls, Nvidia, which is the most important company on the NASDAQ, Nvidia
[15:35] movement. Spaceex isn't part of and its price is lower than its IPO price, right? So the stock went up, then it plummeted quite a bit. Tesla is currently down 2.46%.
[15:49] When a company goes public, folks, it's a flash in the pan; it just money in your pocket, and trade. If you want to short-term operations. Apple is trading sideways quite a bit; you can see it even reached this point in the
[16:01] became positive, then it fell, and so on, okay? Okay, folks, so here we have the SP500, so this movement, the same in Brazil, you can use to trade abroad. I really like using the
[16:16] quite a bit about shifted moving averages in my videos several times, right? I even made several videos uploading it over the weekend, including a dedicated video about it, as part of the trade analysis I do. And it's interesting that the crossover of
[16:29] traditional moving averages works much better abroad than here in Brazil, trend-driven market, it follows a trend more compared to the mini- index or futures here in Brazil as well, okay? So using 6.20 or 721, 921 works well
[16:43] with the stochastic oscillator, uh, sorry, with a moving average of 269 on the 5-minute chart as well. The Nasdaq is already a more volatile asset. Then I would trade using shifted moving averages, which allows you to see higher volatility, leading to
[16:56] faster scalping, so that would also be a good option, okay? So here, guys, is activate Black Arrow, okay? The Black Arrow Plus, in my case it's the Pro version Updating Plus, but nothing changed, right? The features have actually improved
[17:10] , haven't they? It costs $3 a month, but it 's free on FX Globo, right? Here are the requirements, you don't need to pay anything, no minimum volume, no hidden fees, and you can start trading with just $, okay? So it's very cheap, it's very easy there,
[17:23] you just have to keep it active by logging into the platform, it okay? And here's how I'm telling you guys, about the promotion: if you guess the score of the World Cup final , which will take place on
[17:36] July 19th, you'll be entered into the draw for 17 Pro Max, okay? The lots, right? For you to operate. It has step-by-step instructions; I'll leave the link so guys? So, yeah, my bet's already been placed , right? [laughs]
[17:52] Oh, display it here, okay? So, folks, I hope that's made things clearer now regarding trending markets, and the American market, right? So, have greater flexibility. The market will reopen on Sunday evenings
[18:04] thank you very much to everyone who watched. Don't forget to leave a like. forget, you can still register. The phone number is in the description, right? Exclusive promotion, lifetime support, and on the 28th, things get straight to the point. My
[18:18] artwork's right here, right? I'll put it here on the screen for you, and the link is in the description for more information. Thank you very much, and see you in our next class. Have a great weekend! our next class. Have a great weekend!

⚡ Saved you 0h 18m reading this? Transcribe any YouTube video for free — no signup needed.