
Why Trending Markets Are Easy to Trade
54sHighlights a common pain point and sets up a promise of a solution, making viewers curious to learn more.
▶ Play Clip"Delivers a practical, actionable strategy for sideways markets, though it's a basic approach with some repetition."
This video presents a trading strategy for sideways (range-bound) markets using two indicators: Bollinger Bands and ADX. The presenter demonstrates how to identify non-trending conditions (ADX below 25) and execute buy/sell signals based on touches of the Bollinger Bands, with clear entry, stop-loss, and target rules. The tutorial includes a step-by-step guide to configuring the indicators and a live chart demonstration.
The market often trends, but sometimes moves sideways, which is where traders face difficulties. The video aims to show a model to take advantage of sideways movements.
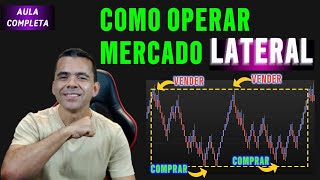
The goal is to buy at lows and sell at highs within a sideways scenario, making trades of 100-200 points without getting stopped out.
Two indicators are used: Bollinger Bands (well-known) and ADX (essential for identifying trends). ADX above 25/30 indicates trending; below indicates sideways.
Buy signal: ADX below 25, touch lower Bollinger Band, positive candle closing within band. Sell signal: ADX below 25, touch upper band, negative candle closing within band. Target is 100% of risk or opposite band.
Insert Bollinger Bands and ADX indicators. Create a color rule for ADX to turn green when below 25, indicating sideways market.
The strategy works best on a Renko 10R chart, which filters noise. Candlestick format can be used for testing to see wicks.
Entry above the high of a positive box (blue) for buys, stop 10 points below the low. Target is 100% of risk or the upper Bollinger Band, whichever comes first.
Demonstrates multiple trades: buy at lower band with ADX green, target 130 points; sell at upper band with red box, target 150 points. All trades hit targets.
The demonstration uses a simulator, not a real account, for educational purposes.
The strategy effectively trades sideways markets by combining ADX (to confirm non-trending) with Bollinger Bands (to identify support/resistance). With clear rules for entry, stop, and target, it aims to capture consistent profits in range-bound conditions.
What two indicators are used in the sideways market strategy?
Bollinger Bands and ADX.
01:38
What ADX value indicates a sideways market?
ADX below 25.
02:06
What is the buy trigger condition?
ADX below 25, touch lower Bollinger Band, and a positive candle closing within the band.
02:21
What is the sell trigger condition?
ADX below 25, touch upper Bollinger Band, and a negative candle closing within the band.
02:36
What is the target for each trade?
Either 100% of the risk (distance from entry to stop) or the opposite Bollinger Band, whichever comes first.
07:18
What chart type is recommended for this strategy?
Renko chart (10R).
05:09
How is the stop-loss placed for a buy trade?
10 points below the low of the entry candle.
07:04
Two-indicator combo
Combining Bollinger Bands with ADX provides a clear filter for sideways markets, a common challenge for traders.
01:38Clear trigger rules
Defines exact conditions for buy/sell signals, removing ambiguity and making the strategy executable.
02:21Renko chart preference
Using Renko charts reduces noise and improves signal clarity, a valuable insight for technical traders.
05:09Risk-reward target
Setting target at 100% of risk or opposite band provides a consistent risk-reward ratio, essential for long-term profitability.
07:18[00:01] Look at that, the market is trending, with descending tops and bottoms , making it easy to trade, right? Often, the market works this way, always trending, but there are some times when
[00:14] the market doesn't trend, the market moves sideways. And that's where we usually encounter major difficulties. And in today's video, I want to show you a way, a model for operating based on indicators
[00:29] that will visually show you how to take advantage of this situation. How great would it be if we could take advantage of the market, for example, to make a purchase here at this point, to catch this upward movement
[00:42] point, to catch this upward movement , right? And also be able to take a sell position here at the top and ride the downward movement, perhaps being able to buy here, or sell here at the top. So, it would be wonderful if we
[00:55] could actually take advantage of these market movements and, within a scenario of sideways market movement, make trades of 100 points, 150 points, 200 points, 70 points, that is, within a completely
[01:11] sideways scenario, instead of getting burned and having our losses triggered. That's what I'm going to show you in today's video. And so that I can illustrate this for you on the chart, to show you directly what you need to
[01:25] directly what you need to achieve this performance, to capture these movements favorably, I'm going to suggest that you basically use two indicators. A well-known indicator,
[01:38] Bollinger Bands, works very well. If you know how to use it, it can work excellently in your favor. And the indicator that is essential for us to be able to capture these movements where there is no market trend is
[01:52] the ADX. If I want to identify market trends, I look at the ADX and see how it's performing. It's trading above 25, above 30. He's telling me that the market is trending, and if it trades below that, it's a
[02:06] sideways market. And that's where I'll look to identify the points where I can take advantage of using this indicator. Our buy and sell triggers will be based on this indicator combined with Bollinger Bands.
[02:21] ADX below 25. When there is a touch at the lower end of the positive candle closing within the Bollinger Band to trigger a buy signal. In the case of a sell signal, I also need the ADX to be below 25.
[02:36] I'll need a slight adjustment to the upper end of the Bollinger Band. And then I'll need a negative candle closing within the Bollinger Band. We'll show the target of the operation on the screen, but that will be either 100%
[02:49] risky or the opposite end of the spectrum from the entry point. Let's insert our indicators here in the chart . Right-click, insert Bollinger Band indicator. Insert it directly into the chart. Right-click, insert. Indicator. Search
[03:03] for ADX. When I enter it here in the lower window, I click OK. I told you that whenever the indicator is working below 25, it's validating visually appealing, I'm going to teach you how to add a color rule to this
[03:18] indicator so that it shows me that it's validated for the operation. Let's right-click here on this line and create a color rule. in the search engine, I'll put in the ADX, and it shows it to me. I put it here, drag it over here
[03:30] shows it to me. I put it here, drag it over here . If the ADX is less than or equal to the . If the ADX is less than or equal to the value 25, I want it to show the ADX in green, which is a standard signal indicating that it's enabled
[03:42] for operation. Once that's done, add the strategy. It's added below. And then we can go here to the little floppy disk and click. He asks me to put a color, a name here. I'm going to run the
[03:54] ADX test. That's the name of my color rule. ADX test. Send it to save. As I've saved. I'm not going to click save, you guys click save. The rule has already been created. I need to apply it here. So let's right-click
[04:07] on the ADX line again. Insert the coloring rule, okay? Mine's right here. The ADX test is the ADX test, right? If you a list will appear here, add the ADX test there, apply it here in the
[04:23] ADX line, and click OK. From now on, we have the ADX in green in some areas and orange in others. We're asking you to double-click on the configuration. We're going to look at the appearance here, and we're going to leave the appearance
[04:38] in gray and increase the thickness. The pattern will be gray. input for us, it's enabling our trigger there. Give it an apply, give it an OK. And now, whenever the ADX is below 25, it will turn
[04:54] green. We are in a sideways market. The market here is sideways. ADX is green, look. You're working inside Bollinger's here, right? Very good. So, I have now configured my two indicators, and I just need to
[05:09] point out to you that this chart here is a Renco chart, a Renco 10R chart, the most favorable for this model. Renco typically doesn't have this wick, like candlesticks, but I need it here to test it
[05:24] so you can identify this information, which is how far it went, what that shade. So, right-click here on one of the boxes here, like, I can have the automatic option. Look, he doesn't cast a shadow for me. And if I
[05:40] right-click and say I want it in candlestick format, then it will show take the test, click here. It's great that I have this, okay? The market operates within Bollinger Band; there's nothing to be done. When am I going to do something? When I see
[05:55] my ADX trading below 25, it will be green, indicating that I'm in a sideways market. It identifies this for me, so I have the possibility to trade because the Bollinger Bands
[06:08] work in this way, kind of drawing support and resistance points for me . So, the lower Bollinger Band is acting as support for me at this point. So, I 'll look at her and see that she's touching it
[06:21] here. I make an entry when I said that when I have a said that when I have a positive box, right, a blue box, I'm going to mark its maximum and make an entry right above it. Usually it's doable,
[06:36] sometimes it's not because it's too quick, right? So you put it in order, sometimes he passes by, comes back, looks for it in order, you'll see in a little while. So the ideal thing to do here is what I'm going to do. Blue box, I'll put an order above it.
[06:50] Generally, since we're talking about the mini-index, it's about 10 points higher, okay? If it does n't work, come down here, I'll wait for another call. Here he played again, so I would have an entry point here. Entry happens.
[07:04] From there, I'll have the entry point here, the stop 10 points below the low of the bottom. Projecting from here to the entry point, I will have my target in the operation. It can be of two forms. My target can be 100% of my risk, that
[07:18] is, 100% of the projection. If the Bolling band is the Bolling band is too narrow or too low before projection, I will set it as the limit. So, either the upper band or 100% will be my
[07:33] target. Okay, then. Look, here we have the market starting to starting to work laterally, and have already made moves for that. And it is ADX who is . Down here it's already green, okay? Like,
[07:51] folks, we always say to be doing the entry 10 points above, quickly, sometimes we even need to go into the market, okay? Just so we can identify it here, we have a top here, a bottom here, right? So
[08:07] resistance levels there, making that move. You can see that the Boliger and the Boliger are parallel, right? So here we have, look, a touch down here, a return, and
[08:19] look, a touch down here, a return, and a candle, sorry, a blue box here already ring; we need a ringtone that turns on a blue box. Since he'll be staying here, we'll enter from this
[08:31] projections. Let me zoom in a little bit here, it 's very visual, see? He's playing down here, so we already have that possibility, look, it's already been created there. I'm going to go grocery a little further. Ready. Look, he made a little entrance here. From there, how am
[08:47] I supposed to proceed? I'm going to place my stop loss at the lowest point of the price movement. The entrance was at that point. He's going to project 100% up here. So my exit will be at 100% of the movement or at the higher end, whichever comes first. The stop loss is placed
[09:04] down here at the lowest point. 130 point target, 130 point stop, everything enabled here. A positive blue candle after touching the Bollinger Bands
[09:16] after touching the Bollinger Bands with my ADX green here.
[09:29] the stop here and then wait for a new trade. So now we have a new touch here on the bottom band with the ADX in green. What do I need? from
[09:41] a blue box to enable entry for us. Oh, I'm having this blue box here. Let's see how it ends. There might be a new entry point in the purchase there, look. Validated below. And all I need here is for this blue box to close.
[09:57] Most of the time, the entry will probably always be through the market, okay? He doesn't have a set time for the boxing session, right? He might stay here for seconds, minutes, right? So it depends a lot on the volume being traded at that moment. So,
[10:12] opening the next box, I know I have an opportunity to have an opportunity to operate here. Alright, look, the new box is up there. So he violated it, I have entry. Projection of my target. Look, stop at the
[10:25] low, drag it down to the entry point. And I automatically have a 100% target there. Top down here. Coincidentally, another Coincidentally, another 130-point trade. There we go,
[10:49] the target has been hit again, folks. Oh, finishing up this red box here, it's a sales trigger for us, see? It's validated down here, it's validated up there validated down here, it's validated up there . Let's see if he finishes here for
[11:02] us, trigger the entry, look. It trigger the entry, look. It closed down a little further down, right? Oh, you see he activated it, right? So we can place a
[11:16] purchase order right here below, 150 points. Top way up there too, 150 points. Just
[11:29] us to follow this trading a little more doing? Working with a simulator, okay? So it's
[11:46] not a real account, it's a simulator. Let me make it perfectly clear that, since this is educational content, it's a lesson so that we can truly understand how it works. truly understand how it works. [Music]
[12:07] Alright, so another target beat, right? We had examples of that in buying, examples of selling. So, folks, I hope today's video has helped you, contributed to your learning, and
[12:20] helped you understand the market better. I hope this helps in some way, that helpful to you, please subscribe to the channel, leave a like , turn on notifications, and of course, follow us
[12:34] notifications, and of course, follow us all, until next time. May God be with you. Goodbye.




⚡ Saved you 0h 12m reading this? Transcribe any YouTube video for free — no signup needed.