
CPI Shock: Inflation Lower Than Expected!
45sHigh-impact economic news (CPI miss) drives immediate market reaction, creating a clear, teachable moment for traders.
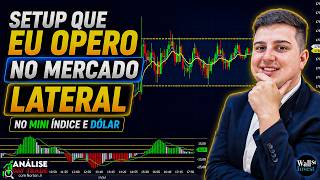
▶ Play Clip"Title accurately describes the content: a setup for trading sideways markets in Mini Índice and dollar."
This trade analysis video discusses the market reaction to lower-than-expected US CPI inflation data, which triggered a global rally. The presenter explains how to trade in a sideways market using price action and the slow stochastic oscillator, with examples from the Brazilian Mini Índice and US markets.
Markets were positive globally due to expected US CPI data release at 9:30 AM Brasília time.
CPI (Consumer Price Index) measures US inflation. June data showed lower-than-expected inflation, which is positive because it reduces pressure for high interest rates.
Despite good inflation news, caution is needed due to rising Middle East conflicts causing oil prices to increase, which could reignite inflation.
Mini Índice up 0.3%, dollar down 1.19%, Petrobras down 0.4%, Vale up almost 2%, oil up 0.9% at ~$84/barrel, S&P 500 up 0.5%, Nasdaq up 1.7%, gold up 1.5%.
The dollar index (DXY) had a strong drop at 9:30 AM due to the CPI release.
US consumer inflation for June came in at -0.4% (deflation), with annual inflation at 3.5% vs expected 3.9%.
The market is currently moving sideways, making it suitable for certain trading strategies.
A gigantic bullish candle formed at 9:30 AM, rising ~1700 points on the 5-minute chart, driven by positive US news.
Using candlestick patterns like shooting star and hammer has given better trades in this sideways market.
For sideways markets, the slow stochastic oscillator (3-period setting) is recommended: above 80 = sell signal, below 20 = buy signal.
Wait for candle close. For sell: candle closes above 80, next candle breaks low of previous. For buy: candle closes below 20, next candle breaks high.
5-minute chart is a good balance. Shorter timeframes offer more entries but less accuracy; larger timeframes have higher success rate but fewer trades.
Watch for producer price index release tomorrow at 9:30 AM. Vale stock soared ~2.5% today.
Nikkei up ~2%, Nasdaq up 1.4%, Hong Kong up 1.27%, S&P 500 up 0.5%, Bitcoin up ~4%, gold up 1.5%, oil up 1.5%.
Inside bar pattern has been successful: 9 inside bars, 7 resulted in gains. Avoid trading before 10 AM.
The video emphasizes that lower US inflation is bullish for risk assets, but traders should remain cautious due to geopolitical risks. For sideways markets, price action and the slow stochastic oscillator are effective tools.
What does CPI stand for?
Consumer Price Index
00:14
What was the US consumer inflation rate for June?
-0.4% (deflation)
04:46
What is the annual inflation rate in the US according to the video?
3.5%
05:02
What does a stochastic oscillator reading above 80 indicate?
A sell signal
10:10
What does a stochastic oscillator reading below 20 indicate?
A buy signal
10:23
What is the recommended stochastic oscillator period for sideways markets?
3-period setting
10:10
What is the ideal time to avoid trading according to the video?
Before 10 AM
17:24
How many inside bars were observed and how many resulted in gains?
9 inside bars, 7 resulted in gains
17:11
What is the risk-reward ratio recommended for trades?
1:1 proportional target
11:17
What candlestick pattern indicates a reversal and has a top wick at least twice the body?
Shooting star
08:22
CPI Data Impact
Explains how lower-than-expected inflation drives market optimism and reduces pressure for high interest rates.
00:14Geopolitical Risk Caution
Highlights that rising oil prices due to Middle East conflicts could reverse inflation gains, a key risk factor.
01:10US Deflation Fact
Reports actual deflation (-0.4%) in US consumer prices, a rare and significant economic event.
04:46Sideways Market Strategy
Recommends slow stochastic oscillator over moving averages for range-bound markets, a practical technique.
09:58Inside Bar Success Rate
Demonstrates a 78% win rate (7/9) using inside bar pattern in sideways market, a quantifiable edge.
17:11[00:02] trade analysis video. My name is Norton, and today the markets were very positive across the globe, in Brazil, Asia, and Europe, due to economic data that was expected to be released today at
[00:14] 9:30 AM Brasília time. This economic data is called CPI, or Customer Price Index, or what we know as IPSA here in Brazil. It's an economic indicator released in the United States to show the latest inflation rate for
[00:29] this case was June, and the accumulated inflation over the last 12 months. And accumulated inflation over the last 12 months. And inflation came in lower than expected. This is very positive economic data, because if inflation is falling,
[00:42] consequently there is no reason to have such high interest rates. There in the United States, and inflation figures were released last Friday, and they also came in lower, and expectations also fell below expectations in the United States . This is very good news. However, folks, we have to be
[00:58] a little cautious and not just cut interest rates arbitrarily, cutting interest rates immediately.
[01:10] Middle East, which has now worsened, it seemed to be well resolved, because in fact in June oil prices plummeted quite a bit, returning to pre-war levels, right? And this increase in these conflicts has caused the price of
[01:23] oil to rise, and today it's rising another 2%, another stone from 80-something to 84 per barrel, and this could generate a rise again in inflation for the in the next chapters, how the market will react, and what the
[01:39] market expects for the upcoming interest rate decision meetings, both in Brazil and the United States. Folks, Mines is up 0.3% today, while the dollar is currently down 1.19%. A very considerable drop in the mini-dollar. We
[01:52] currently have Petrobras down 0.4%, while Vale is up almost 2%, a the minute up quite a bit. Right now, oil is up 0.9%, which
[02:04] isn't a very significant increase, okay? The price of a barrel was around $84, . So, a very volatile price. We have the S&P 500 up
[02:16] 0.5%, the DAC technology index up 1.7%, and gold currently up 1.5% market, analyze the whole context, analyze the chart, and determine the impact of the
[02:28] news. I even told you on Friday that many traders who only trade, and have students and people who follow us here, only trade on big days and with big news, which is the case today, Super Wednesday, the payroll data, and the
[02:41] will be a producer data release in the United States, which is a chain reaction, because if producer inflation increases more than expected, this can generate a domino effect that can also impact
[02:55] consumers. This ultimately increases the consumer inflation rate, also known as IPCA here in Brazil, right? So let's analyze the market. Guys, the live online trading course starts today. Today and
[03:08] tomorrow, Thursday, from 7 PM to 10 PM. Registration for this course is now open, okay? You'll have lifetime support and can retake the course on the screen, the link is in the description so you don't miss the opportunity to
[03:21] next week the course on trading in the American and international markets begins, like, subscribe to the channel, and turn on notifications so you don't miss comment! Yesterday's video was a hit, wasn't it? I'll continue with
[03:37] that I've been sharing with you over the last few days, okay? So let's get to forget to leave your comment, that 's the most important thing. Criticism, praise, and suggestions are always very welcome. Okay, folks, we're here at the
[03:50] using a platform from Profit Pro, a brokerage firm called Touro, which is the brokerage operations in international markets.
[04:06] a sharp drop yesterday, which was expected due to the Brazilian president's statements regarding the Strait of Hormuz and surrounding foreign investors' willingness to invest in Brazil. Well,
[04:20] Milidor has already had a pretty big fall. In fact, the mini door didn't just have a drop in relation to the real one, but the door itself, the doll index, which is known as DXY, also had a very strong drop here at 9, 9:30 in the morning.
[04:33] Because today, folks, if we look at the economic calendar here, I've filtered only by impacts, high impact. Look , today is July 14th, the inflation rate, consumer inflation, it came in and the expectation was for no inflation,
[04:46] United States for the month of June, however it came in at -0.4%. So, there was deflation in the United States. So what is core annual inflation? what exactly is this? That is accumulated inflation. So we take
[05:02] the accumulated inflation rate here in the United States, right? There's an inflation rate for . Look here, the annual inflation rate is at 3.5, but the expected rate was 3.9. So, the expectation came in low , which is very
[05:16] good news. Tomorrow the producer price inflation figures will be released , right? Okay folks, and at the end of the month, on July 30th, which will be a Wednesday, the decision on the US interest rate will be announced... sorry, folks, on July 29th, a
[05:30] Wednesday. So this folks, because less inflation, less interest, less money invested in fixed income and more money invested in variable income, okay? The
[05:45] same surge and sustained performance as the S&P 500 or discuss further in the international market. If we take a look back at the Petrobras is currently down 0.2%, practically at break-even, because oil
[06:00] is also practically at break-even in the Middle East. Bradesco, Itaú, and the major banks in Brazil, including Banco BTG here, they all mixed today, if you look at it.
[06:18] today. So, it can be considered that the market is currently moving sideways, right? Norton, how do I manage to operate a day full of news, you know? This candle here, folks, from 9:30 in the morning, was a gigantic bullish candle. It was a candle in
[06:34] terms of points, 100 points, almost 1700 points on the 5-minute chart. If we look at it this way, he arrived in the second band of Vioap Band, right? So it was a rise, for you, a very strong rise and a very considerable rise, right? It was
[06:49] precisely driven by the positive news regarding the United States. When that happens, folks, the market reacts immediately. So if you understand that inflation lower than expected is a good thing, many
[07:01] people buy right then and there. Of course, you can't buy at the exact moment the candle is forming, develops at the time the news is released, right? But many students, I saw that people took the course in the last class, including a class starting today, right?
[07:14] a class starting today, right? stop loss slightly below this low here and a proportional target of one to one. Could we have caught more? It gave. Nobody has a
[07:28] relatively quick operation. I waited 5 minutes and he already caught it, and he already caught the target of the operation. Since it's personal news, it usually has an impact at the time of the candle. It throughout the day, unless the actions cooperate, right? So, with Petrobras
[07:43] soaring, with banks soaring, then yes, the market tends to react in a more positive way and tends to continue rising. Many people who bought here, look, left the Stop Gang on the second VAP band, look, on the second VOAP band up here
[07:57] , right, which was a great Stop Gang. He arrived right here and then turned back. but I think it's too long, guys, leaving it That's a great size for the second band too, right? So when you're
[08:09] trading, this is a very important economic factor that you need to pay attention to market died, but for those who did pure price section analysis, which I 've done in several videos here on the channel using, for example, shooting star,
[08:22] inverted hammer, hammer, it has given better trades, given more success in the trades. So this candle here, 25 , is a bearish candle, right? It's a bearish candlestick, and it's a candlestick that indicates a reversal of movement, which is
[08:35] meet certain criteria to be considered a shooting star. The top wick must be twice or more the size of the body. The bottom wick must be irrelevant.
[08:50] usually call a resistance area, which in this case, besides being in a resistance area here, it's at 179,000 points, right? But it's a very famous region, people really like these important regions of the
[09:03] graph. We have here the first VAP band, right, which is generally broke off without looking back because of the news, but afterwards he was very respectful here and many people went short when Ken closed. Stop loss
[09:16] slightly above that high, 100 points above, and a proportional target of one to one. It took a little while to hit the target, but it was quite interesting too, okay? So, it indicates that with the sideways market as it is today, folks, try to
[09:30] make trades using price action, pure candlestick reading. Why? If you use, for example, moving averages, it even worked for a while in this downward crossover here, right? Crossed down, two kendos from below, 44 and 45. I'm using
[09:44] the traditional 6.20. And MAC in the default configuration 26 12 9. Red MC, entry here on candle 47, right? He just popped in here , played a game try trading moving average crossovers in the market in a situation like this. Whether it's
[09:58] better to trade the price section, which involves trading highs and lows using chart patterns like hammers and shooting stars, or to use what I usually use, which is the slow stochastic oscillator, a very good type of trade for
[10:10] when the market is sideways. I use slow storage in the three-period setting, okay? And it only operates in a sideways market. How will you use this indicator? It fluctuates between 0 and 100. And when it 's above 80, it indicates a sell signal. And when
[10:23] it's below 20, it indicates a buy, okay? [snoring] How is this operation going to work here? If you look at candle 40, the stochastic oscillator was previously at , let me take the exact value it was at, 87. But
[10:35] remember to wait for the candle to close before entering the trade, because there's no point in trying to enter a trade when the candle hasn't closed yet, right? Because sometimes the 500 information and the stock are above 80, but when
[10:48] it closes, it closes below 80 and it's not worth anything, right? So, C closed with a cool score above 80. How do I make my entry? The candle closed at 40. The next candle, if it breaks the low of the previous candle above 80, I
[11:02] happened. Kendrick 41 broke through the low. [snoring] It would be more or less here. And then I'll set a proportional target. Hey, the target is a one-on-
[11:17] one target, right? A proportional target in the operation here. The market came in and ended up number 45. In this case, there wasn't much trouble, right? And here, Norton, this candle here, candle 44, if you think it was below 20, wouldn't that indicate a
[11:32] buy? In theory, yes, but in practice, no. Why? Because Kle 45 didn't break the high of Kleon 44. And an ideal point is also to always try to buy at the low of the sideways movement. You draw a rectangle here, right? You set up a box
[11:46] here and I look to operate in these regions, right? Even though there was a purchase opportunity here with stock that was below 20, the Keno 45 didn't break the 44 high, which didn't trigger a buy signal, right? It was a different scene here, you see. Here, Ken
[12:00] 49 was below 20, and Ken, despite having a good upward movement, Ken 50, the stock, when it closed, was marking more than 20, it was marking 23 and a bit, so it's not good, right?
[12:13] An entry point opened here as well. So, minute timeframes; if you want to trade on other timeframes, it works the same way. Shorter timeframes also offer more entry points, but are less accurate, right?
[12:29] Smaller stops. So, for larger charts, you're more assertive, with a higher success rate, but there are fewer trades throughout the day. I aim for 5 minutes, which is then was trending downwards, but then it moved sideways. The same pressure
[12:41] index, you can also apply to trades on the mini-do. But today he really switched sides completely, didn't he? He really messed with the trader today, didn't he? Today, Minidor experienced low-level movement early in the day, used up all its fuel, and then it
[12:54] completely stopped moving, right? So today was a slightly more Vap Bands, Price, or Stocasticulento have seen my trade moving average crossovers or sideways trading when the market is sideways, and they've done
[13:08] very well too, okay? OK. Of course, you can't help but pay attention to what's happening in the coming days, Brazil, right? Keep an eye on oil prices, keep an eye on producer price index, which will be released at 9:30 AM. If it comes in low, that's
[13:22] good news; it doesn't have such a strong impact on the consumer, but it's also a very important economic indicator, okay ? Keep a close eye on Vale, because Vale's stock soared today, reaching a peak of
[13:36] around 2.5% , right? So, for those who trade this index, also called the Doll index, okay? We're going to the international market, we're here on the Black Air platform, from the
[13:50] FX Globo brokerage, which is the brokerage I use. There are other brokers that also In fact, one of them is Ninja Trader, which is a brokerage firm that I also use international market, okay? I'll even leave the link below
[14:02] for anyone who wants to get Black Air for free; if you have a balance of $ or more in your FX Globe brokerage account, the platform becomes completely free. And of course, folks, they ask you to make a small transaction of one microlot per
[14:14] month, it can be on EuroSD to maintain the free access, okay? Now, if you want to, official American market," you can find it here. I left the link for you in the Ninja description, okay, everyone? By clicking on this link here, you'll click on "get
[14:27] you'll do the following: you'll enter your email address. You don't need to money, you don't need to do anything, nothing, nothing, nothing, okay? Just complete the initial registration; you can test the simulator on the platform if you want to, and then, if
[14:41] guys, you don't need to make a deposit or anything. I'll put the email here: [email protected], okay? Click here to subscribe. They're going to your email address in, of course, right? I'll send it to you. Then you confirm and you'll have
[14:54] test it in the international market, okay? The link is in the description. So international market. Guys, what do we have here? We have here, I'll get the global summary. You see that most of the entire world is going up today. Here we have
[15:09] the Japanese index, NK, up almost 2%, NASDAQ up 1.4%, Hong Kong up 1.27%, 2%, NASDAQ up 1.4%, Hong Kong up 1.27%, SP500 up 0.5%, the French CAC index up 0.30%, and the Dow Jones is currently up 0.05%, practically at 0%.
[15:24] Bitcoin is up strongly, more or less almost 4%, gold is up about 1.5%, 4%, gold is up about 1.5%, silver 1.5%, and oil 1.50%. Look, everyone, this is the SP500 chart, right? The price surge today was
[15:37] US inflation came in below expectations. The Nasdaq and the Dow Jones also experienced similar movements shortly after the can see that right after the
[15:50] news broke, not only Brazil, but practically the whole world was sideways , right? So the market didn't have much demand and there most assets, right? Even in the United States. Sure, the S&P Nasdaq, where
[16:06] the American technology index went up, then everything came back down, it went up again and closed [clearing throat] at the peak of the day, right? The Dow Jones, which is also very active, is also quite stagnant. As for gold, folks, it skyrocketed afterward, almost reversing all the gains
[16:18] it had made after the news broke, right? And oil is currently up 1.6%, nearing $84 a barrel. Yesterday, which actually saw that surge, right? The price of oil went up almost 10% yesterday, right? It's a very strong increase, and it's a
[16:32] very reliable indicator of how the war is going. So, oil, if you look at the oil market, it's experiencing some very interesting movements, right? Well, it's Middle East that he's been involved in various movements. So, folks,
[16:45] for those who trade in the American market, the SP500 is a single asset that operates 23 hours a day, learn how to trade in the American market? Next week, the description so you can contact me and register.
[16:57] Well, it's an asset that allows you to trade everything you do here in Brazil, and also operation I mentioned to you, the slow stochastic oscillator, works very well there. But today he wasn't as lateral as Mins was, he had ups and downs, right? In fact,
[17:11] which I've been making several videos about on this channel recently, it's worked out very well, right? Because today we had an inside bar, actually, 1 2 3 4 5 6 7 8. Now with this
[17:24] last one that happened, that makes nine inside bars, right? And of those nine, seven resulted in gains, even though the market was relatively sideways, right? So, this movement that happened here, for those who traded in sidebar, for example, you don't trade in sidebar before 10 am. sideways, right? So, this movement that happened here, for those who traded in sidebar, for example, you don't trade in sidebar before 10 am.
[17:39] ideal time for you to operate, okay? Oh, a sell signal was triggered here; the 148 broke the low of the 147, stop loss slightly above that high, and a proportional target of one to 's already in dollars. Here you can switch between a real account and a
[17:53] simulator account if you want, okay? Same thing here, look. Kend here, at the time it did n't rupture, so it wasn't admitted. Oh, K 168 broke through the high of 167. There's a buy signal just a little below that low, and the alpha is proportional to
[18:05] one, right? It took a little longer, but it eventually caught on. So, for those who shorter timeframes and scalp, a good asset to trade is the Nasdaq, which goes up and down faster. You need a bit more of a stomach for it, but it's also an asset that
[18:18] responds very well to chart analysis , okay? The euro SD is trade the inside bar until Peru catches the downward movement here. Gold is so everything you trade in Brazil you can trade there, but the
[18:32] asset with less volatility, like oil, right? Oil and gold are assets volatility, right? So I you. Be careful tomorrow regarding personal producer inflation
[18:45] . So today the direct-to-the- point live stream begins, and registrations are still open description. It has vital support. You can retake the course as many times as you need with me and Suda, okay?
[19:07] with Ninja on the Ninja platform, which is completely free, will receive the R$450, but they'll give it to you for free too, okay? So leave a bell so you don't miss anything, and we'll see you in our next class, God
[19:20] willing, tomorrow. And most importantly, your comment is valuable. Any questions, suggestions, or criticisms? Feel free to share them. Hugs and see you next time.

⚡ Saved you 0h 19m reading this? Transcribe any YouTube video for free — no signup needed.