

3 Types of Breakouts You Must Know
44sQuickly outlines three core breakout types, hooking beginners with a clear, actionable framework.
▶ Play Clip"Title accurately reflects the content: a simple and effective breakout strategy for beginners."
This video teaches a breakout trading strategy for beginners, focusing on identifying structural changes in trends and ranges. The instructor explains how to trade breakouts by waiting for pullbacks after a confirmed breakout, emphasizing the importance of trading at market extremes.
The video covers the breakout strategy, a simple and effective trading method. It addresses common confusion about how to use breakouts correctly.
Breakouts are divided into three types: in an uptrend looking for a downside change, in a downtrend looking for an upside change, and in sideways ranges.
To trade a breakout, identify a change in structure: when an impulse is no longer larger than the previous one, expect a breakout. Confirm when the chart breaks the last low with high volume and speed.
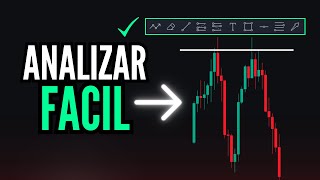
For ranges, identify a confirmed zone. Breakouts at the top or bottom of a trend are more effective. After breakout, wait for a pullback to the line.
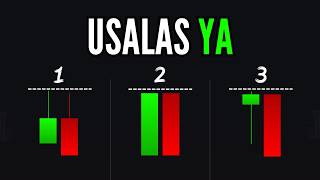
Breakouts alone are not the strategy; confirm with candlestick patterns or a clash of highs. A candle closing near the line confirms the trade.
For a downtrend reversal, look for a breakout to the upside. The entry model is the same: breakout, pullback, then trade.
In an uptrend at its highest point, when an impulse no longer surpasses the previous one, break the last low. Wait for a pullback to execute the trade.
Breakouts are a simple and effective strategy for beginners. Always trade at extremes (high or low points) for best results.
The breakout strategy is a powerful tool for traders when applied correctly at market extremes. By waiting for pullbacks after a confirmed breakout and using candlestick patterns for confirmation, traders can execute high-probability trades.
What are the three types of breakouts mentioned?
In an uptrend looking for downside change, in a downtrend looking for upside change, and in sideways ranges.
00:39
How do you identify a change in structure for a breakout?
When an impulse is no longer larger than the previous one, expect a change. Confirm when the chart breaks the last low with high volume and speed.
01:34
What should you do after a breakout occurs?
Wait for a pullback to the broken level before entering a trade.
02:02
Why is it important to trade breakouts at market extremes?
Because breakouts at the top or bottom of a trend are more effective and provide certainty that the change in structure will fill the space left by the previous trend.
03:40
What additional confirmation is needed besides the breakout?
Candlestick patterns or a clash of highs; a candle closing near the line confirms the trade.
05:03
In an uptrend, should you look for a breakout to the upside or downside?
Downside, because you are looking for a change in structure.
10:18
What is the entry pattern for a downside breakout?
In an uptrend at its highest point, when an impulse no longer surpasses the previous one, break the last low, then wait for a pullback.
09:23
Change in Structure
Core concept: identifying when a trend is weakening is key to breakout trading.
01:34Trade at Extremes
Emphasizes that breakouts are most effective at market extremes, not in the middle of a trend.
03:40Confirmation with Candlesticks
Highlights that breakouts alone are insufficient; candlestick patterns provide confirmation.
05:03Breakout Direction Rule
Simple rule: in an uptrend look for downside breakout, in downtrend look for upside breakout.
10:18[00:01] one of the easiest and most effective strategies you can find in trading. So stay until the end of this video and don't miss any details. We're in a new trading lesson, and today, traders, I'm
[00:13] going to teach you the breakout strategy in detail. Surely, during your trading journey, you've heard about breakouts. But there's a lot of confusion regarding how to use breakouts, how to
[00:26] trade them correctly, and the types of breakouts that exist. So, the first thing you need to know is that in order for you to trade a breakout, the most important thing is that you must have a real zone that the chart can break through. That is, it's
[00:39] not like the chart simply breaks through an impulse and you can start trading. No, normally we're going to divide it into three or four ways to trade breakouts. One would be in an uptrend, looking for
[00:54] a change in structure to the downside. That would be the first. The second would be in a downtrend, looking for a breakout or change in structure to the upside. And finally, we're going to identify it in sideways zones or ranges
[01:08] to have a change in structure. So, I'm going to explain each one to you. So pay close attention to this detail. It's worth mentioning that there are different variations where you can also use chart patterns or figures
[01:21] like breakouts. But we'll look at that a little later. The first thing traders need to know is that to trade a breakout correctly, you must identify a change in structure. That is, in a
[01:34] trend, for example, we always have impulses that are each larger than the previous ones. When an impulse is no longer larger than the previous one, then we can identify or expect a
[01:48] change in structure. To trade a breakout, it's necessary that our chart breaks the last low we have on the chart. Once the chart breaks it with high volume and speed, that's when
[02:02] we confirm that we have a breakout, and we can simply wait for a pullback to trade the change in structure. Also, something super important: in the case of a trend, or if you want to trade a breakout to the downside, for example, you will
[02:17] always identify it at the top of a trend, since you would be looking for the change in structure to the downside. And you will always use the same trend as a reference to know if you are at the bottom
[02:32] or the top of the trend. Let's... To give a very simple example, we'll do the same to use breakouts in ranges, sideways zones, or any type of structure that's stuck between two extremes.
[02:46] In this case, we've identified a range, and for you to trade a breakout, you need a confirmed zone. Normally, you need to verify where on the chart the breakout
[03:00] is located. For example, if I have a sideways zone or range at the top of a trend, at the highest point of the chart structure, then it wouldn't be very effective to look for an upward breakout
[03:14] since the chart is already at its highest point. So, I would suggest using breakouts when the structure changes. For example, here we're at the lowest point of our chart, and we see that it's range-bound.
[03:26] lowest point of our chart, and we see that it's range-bound. a breakout and to use this strategy correctly, you need the chart to break the last high or the
[03:40] last low, depending on the zone you're in. After it breaks out quickly, you'll wait for a pullback that reaches the line exactly. You had previously marked it, and it's at that moment that you're going to look for a
[03:56] trade. And I'm telling you that it's important to use breakouts at the bottom or top of a trend because then you have the certainty that the change in structure will fill the entire space left by the
[04:10] previous trend—something truly simple. Remember that if you want to trade, if you want to start in forex, in the video description you have the link to the broker I use. You also have a video so you know exactly how to start. And if
[04:23] you want to be part of my private trading academy, in the description of this video you have all the details about my academy. So, traders, let's go with this example. We are at the bottom of a trend, and once
[04:36] we confirm that we do indeed have a zone or a range, then what we need is for our chart to break out of this zone. As I was saying, it's at the lowest point. We're going to look for the breakout to the
[04:49] up, and that will be our confirmation. Furthermore, breakouts themselves are not the strategy, since for the strategy to have greater importance, you must confirm it with some other strategy, such as candlestick patterns, for
[05:03] example. So, what happens once the chart breaks out of this channel, this range, or This high we see on our chart breaks through, so we just have to wait for a pullback to continue the upward
[05:17] structural change. Now, pay close attention; this is where the most important part comes in because it's not just about a pullback and that's it. Otherwise, you might have a bad trade or a false
[05:30] breakout. That's why it's so important to tell you that if you're going to trade with this strategy, do it at the extremes of the market. Never look for a breakout in the middle of a trend or in the middle of the market, as it won't be effective. So,
[05:44] to confirm this trade, we're going to use a clash of highs or candlestick patterns. A candlestick should extend, a candlestick with volume that closes as close as possible to our line. That will be the confirmation to trade upwards
[05:56] in this complete structural change. So, let's see what the chart does. For example, you don't know when the pullback is coming, so you just have to trading, you don't have to invent anything. You do n't have to anticipate anything; you
[06:10] simply define your entry pattern, which in this case, as I mentioned, would be which in this case, as I mentioned, would be the structural breakout at the entry pattern, as I've told you in other posts. Videos, something I know has already been repeated,
[06:24] something I know already works, something we've already seen a million times on the chart. So we don't invent anything, we just have to wait for the chart to repeat this entry pattern as closely as possible to be able to trade it.
[06:38] Then that's where the retracement or pullback comes in, which is where you'll get see what's happening. The chart hasn't reached our line yet. It's important that you confirm your trade until it reaches the line. Pay
[06:52] close attention: the candle reaches exactly our line, the same situation as our pattern. It reaches our line, so we can confirm a trade upwards since we're confirming this breakout with
[07:07] candlestick patterns. So at that moment you can prepare your trade. In the case of forex, you simply place your stop loss, you place your take profit with the impulse a little higher than the previous impulse, and that would
[07:19] result in a completely spectacular trade. Because if you use breakouts in the right zone, then you'll always win in mistakes traders make are using strategies in the
[07:35] wrong zones, and that... This results in completely terrible trades. So, traders, here's how to trade a breakout in a structural change from a sideways zone. So pay attention, now I'm going to
[07:48] explain how to do it in a trend reversal. This same thing I just explained would be the same if you wanted to trade it downwards, so I would recommend you take a picture of this. This example or this model that
[08:00] we just made is the breakout to the upside. That is, once you have a range, the chart breaks out, makes a pullback, and you have the entry model. Okay, here you have your perfect range, and once the chart breaks out, you wait for a
[08:13] pullback that touches the high, and there you have the entry model. This would be the entry model for an upward move, looking for your trade here. Now, pay close attention. The entry model for a downward move would be the opposite: an
[08:27] uptrend with a range. At the highest point of this trend, you have the breakout from the last low. You wait for a pullback, and there you have a trade. And it's exactly the same entry model, only we are changing the location.
[08:43] And that is the most important thing so that you can use this strategy if you are going to To make a breakout from a range within a sideways accumulation zone, verify that this accumulation is in the
[08:56] correct zone. This example I 'm showing you here would be a breakout to the downside, but in this case, it would have to break the last low. In this example, it broke the last high here. So
[09:10] we're simply changing the entry pattern. Pay attention because now I'm going to explain how to use breakouts in uptrends and downtrends. Okay, traders, pay very close attention. This is the
[09:23] entry pattern for breakouts to the downside, and it's the same as I explained before. We're going to find ourselves in a trend at its highest point, and when an impulse no longer surpasses the previous one, it must break our last low.
[09:37] Once the chart breaks the last low, we'll only wait for a pullback, and that's when we can execute our trade. So pay very close attention to this entry pattern. Here we have
[09:51] increasingly larger impulses than the previous ones. The chart continues to respect the fundamentals of a trend, so when an impulse is no longer greater than the previous one, we could expect a change in structure, since,
[10:04] as I said, we are in a trend. At the top of the chart, we should look for a structural change or a breakout to the downside. It's very important to note that breakouts are always sought after structural changes. If I
[10:18] had an uptrend, I'm going to look for a breakout to the downside. If I had a downtrend, I'm going to look for a breakout to the upside. It's that simple. So here, the trend continues to develop. But
[10:31] what happens is this: a momentum movement no longer surpasses the previous one. That is, from this point on, it's a pullback. The pullback surpassed the previous ones; this momentum movement is no longer greater. So, at this moment, we're going
[10:45] to mark our line of the last low. You can also see that it has respected it on several occasions. From that point on, you should wait for a deeper move. You can see that the last
[10:59] low coincides with the previous lows, perfect. And in order to trade and confirm a breakout, you need it to break with depth, then wait for a pullback. And that's exactly what our chart is doing: it
[11:12] breaks with greater depth, and now we have to wait for it to pull back and reach our line exactly. Otherwise, we wouldn't be able to confirm that we have a trade. Sometimes it will
[11:26] happen exactly as you just saw, where it simply touches the line, and that's where we use complementary strategies to be able to use breakouts simply and effectively. Here you can see
[11:40] that breakouts are a simple and effective strategy for any trader, especially if you're starting out and looking for a structural changes and the breakout strategy are a great option for
[11:54] all traders. You can always identify a breakout as long as you have a confirmed zone, whether it's an uptrend, a downtrend, or a
[12:06] Here are some examples of exactly how you should do it, but it's very important: if it's a breakout you want to trade downwards, you should look for a high point on the chart. Very simple. If you want to trade an uptrend,
[12:19] then you'll look for the low point on the chart. It's that breakout within a range, well, you'll follow this same principle: at the
[12:31] high or low point of a trend, you wait for the pullback, and then you'll be taking advantage of the entire change in movement and the entire movement with trading breakouts, you'll begin to develop simple and
[12:46] effective strategies. This will result in perfectly executed trades. I traders. Be sure to subscribe to the channel. Leave a like on this video and let me know in the comments if you'd like me to explain each of the
[12:59] breakout patterns with different chart structures. Here's a future video for you to watch, and I'll see you next time, traders.
⚡ Saved you 0h 13m reading this? Transcribe any YouTube video for free — no signup needed.