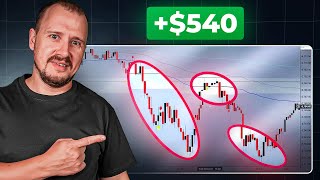

3 Zones That Wipe Out ALL Traders in 2025
44sImmediately presents a bold, life-saving claim that promises to reveal a repeating pattern used by big players, hooking viewers who fear losing money.
▶ Play Clip"Delivers on the core promise of three identifiable liquidation zones, but two sponsor segments and repeated subscription asks dilute the density."
In this trading tutorial, Sergey from the sr Crypto channel breaks down the three recurring liquidation zones that wiped out traders in 2025: false trend breakouts, sideways movements, and deep pullbacks before impulses. He explains the market mechanics behind these traps — how large capital collects retail stop-losses as liquidity — and shows how to identify these zones in advance using higher timeframes and liquidation maps.
Three zones wiped out traders in 2025: false trend breakouts, sideways movements, and deep pullbacks. These are repeating patterns used by large players every cycle, not random occurrences.
Big capital, funds, and participants with millions don't detect movements on 15-minute timeframes. The game is played on at least the daily timeframe, so retail levels on low timeframes are invisible to them.
After a correction, retail goes long with short stops hidden behind levels. The price knocks out these stops with a light prick, a larger position is taken, and the price moves higher. This is the basic principle of market movement — without liquidity there is no fuel for movement.
Liquidation maps (e.g., Binance Bitcoin USDT) show where stop-losses sit, where liquidations occur, and where large capital adds positions. Smaller players hide stops behind extremes while large players place buy orders in those same zones.
Large players place buy orders in three parts below visible levels — not where retail expects. If price is 100,000, the last limit order can sit at a round 50,000. The lower the price, the more liquidations occur, and the big player calmly loads up.
The higher the price climbs, the more dangerous it is to buy, because big players gradually unload previously accumulated positions. They sell in parts since they cannot sell the whole position at once.
Most traders trade with 'blinders' — seeing only one direction. They expect endless growth from a third touch of a rising trend, but the big players who loaded at 78,000 begin unloading above 100,000 and 120,000, painting bearish candles.
A trend breaks, retests from the opposite side (a gorgeous entry point), then stop-losses are knocked out. Short stop-losses become forced buy-closings that the unloading large player buys from. This is the final sell-off.
Don't wait for endless growth and jump into longs until all stop-losses are knocked out. Accept the chart as it is. A breakout of an upward trend can be traded short; consolidation at daily levels is needed to expect continued growth.
The trend seems to approach a break, then tests again, corrects to its highs, and only from there does the downward movement begin. This pattern repeats on all timeframes, with higher timeframes pressuring lower ones.
After selling out, big capital slowly starts loading again. To build a good long position they need liquidity, so the price can dive under strong visible levels — not to shave anyone off, but to load a large position on liquidations or spot.
The market does nothing but most people think it's about to break out. Using BNB on the 4-hour chart, Sergey shows that sideways movements have internal and external ranges, with pins in both directions. Most experienced traders avoid trading flats.
Ideally, wait until there is a clear exit from the range, a significant move lower, and a correction back to the range. From there, look for an entry to continue the downward movement. A false breakout knocks out stops, then price sinks.
An adequate entry is at a clear breakout of the sideways movement — price leaves the range, trades behind it, shows a retest from the opposite side. This is a classic pattern. Sideways movements often form right at the top of a trend.
The moment the market screws everyone who entered correctly but too early. Using Litecoin on the daily timeframe, a long sideways accumulation was followed by an upward shot, but instead of continuing up, the price corrected deeply.
No trader can predict the market. We can only learn to understand market movements on a larger scale and not close ourselves off behind blinders. The market doesn't grow endlessly — it's about emotions and psychology.
Fibonacci is used simply as a ruler to measure correction depth, not as magic. After an upward movement, a drawdown to the zero level (50% from highs) knocks out short-term stop-losses; 80% corrections of the total movement are common.
After a prolonged sideways movement on the daily chart and a good impulse breakout, the price can easily correct almost to the base of the entire upward movement — 80-90% is easy. The most daring purchases are made in these places.
Practice looking at the market from a broader perspective — analyze higher timeframes first, understand the processes there, then transfer to lower timeframes. Liquidity is the basic principle of market movement; money flows from hand to hand.
The three liquidation zones — false trend breakouts, sideways movements, and deep pullbacks — are recurring patterns driven by the need for liquidity. By analyzing higher timeframes first, using liquidation maps, and expecting 80-90% corrections, traders can avoid being the liquidity that fuels big players' positions.
What are the three liquidation zones that wiped out traders in 2025?
False breakout of the trend, sideways movement, and deep pullback before the impulse.
00:02
Why don't large players see retail levels on 15-minute timeframes?
Large capital trades on at least the daily timeframe, so they simply don't see levels on 15-minute or 5-minute charts.
01:55
What is the basic principle of market movement according to the video?
Liquidity is needed for movement — retail stop-losses are knocked out to provide fuel for the development of the movement.
03:10
How does large capital place buy orders relative to retail stop-losses?
Large players place buy orders just below the zone where the majority places their stop-losses, even the most distant ones — not from the support zone itself.
04:10
What correction depth can the price easily reach after an impulse breakout?
80-90% of the total upward movement — the price can correct almost to the base of the entire upward movement.
28:06
How is Fibonacci used in this analysis?
Simply as a ruler to measure the depth of the correction — not as a magical indicator.
26:38
What is the recommended entry for a sideways movement?
Wait for a clear breakout of the sideways range, price trading behind it, then a retest from the opposite side — that is the entry point.
19:52
What happens to short stop-losses when a trend breaks down and retests?
Short stop-losses become forced buy-closings, which the unloading large player buys from — this is the final sell-off.
08:35
Liquidity is the fuel of market movement
Explains the core mechanism — price knocks out stops to gather liquidity, which is the fundamental principle behind all three zones.
03:10Liquidation maps reveal where big players act
Gives a practical, actionable tool to see where stop-losses cluster and where large capital will place orders.
04:24The blinders trap
A memorable metaphor for how retail traders fixate on one direction while big players unload into their optimism.
07:08Expect 80-90% corrections
A concrete, testable number that challenges the common assumption that breakouts continue — key for position sizing and psychology.
28:06No one can predict the future
Reframes trading as probability management and psychology rather than prediction — a mature counterpoint to most crypto content.
24:42[00:02] Now I'll show you three zones that wiped out all traders in 2025. If you've ever witnessed a liquidation, there's a huge chance it happened there. This is not a random occurrence, it is a repeating pattern that the big guys use
[00:16] every cycle. In this video, I'll explain how to identify these zones in advance and how to make money in them while others are wasting their deposits. My name is Sergey. I am the author of the sr Crypto channel, a trader and investor with twenty years of experience. Let's go. Please
[00:30] remember that I do not provide financial advice in my videos . Everyone is responsible for their own decisions. So be vigilant. If you look at the 2025 schedules, the liquidations are happening almost on schedule. And there is a strict
[00:45] pattern there. In 2025, the market operated according to clear logic. The crowd was brought into operated according to clear logic. The crowd was brought into position, given confidence, and their stops were knocked out. liquidations, reversed the price and went into the trend. The liquidations took place in three
[01:00] typical locations. Why does this keep happening? Because the crowd acts the same way. Because the crowd acts the same way. Omo, entry is late, stops are close, the market elimination, be sure to like this video, leave a
[01:14] comment, subscribe to the YouTube channel so you don't get lost, and also subscribe to my Telegram channel. There I post the latest news in the world of cryptocurrency, various bonuses, and promotions. The link will be in
[01:26] the description below the video. Well, we continue. The first liquidation zone is a false breakout of the trend. This is the most common trap. Do you think the market has broken through the level? In reality, this is just a liquidity grab. Let's look at October 10,
[01:40] 1925. I think everyone remembers this event that happened here at the battlefield . But first, let's discuss how a major player who constantly undercuts everyone operates, and why this happens. Firstly, large players,
[01:55] large capitals, funds and other participants with millions will not detect any movements on fifteen-minute time frames. Here the whole game takes place over the long term, at least on the daily time frame, so they
[02:09] simply don’t see your levels on the 15- minute time frame. To understand how big capital thinks, we get used to analyzing the daily trading session . That is, the daily chart gives us full potential for any movement, even on a five-minute chart. And let's analyze any
[02:25] upward impulse, that is, an upward movement. The main thing to understand is that the price cannot move infinitely in one direction. We always have a correction formed at this point. Let's assume that we have formed some level.
[02:41] Let's do it and pay attention to how the price moves. They showed a correction. Here, everyone goes long with short stops . Most traders who work on five-minute, fifteen-minute, even
[02:54] hourly charts. Our stops are located somewhere behind the level, securely hidden, and subsequently the price knocks out all these stops with a light prick. Here a larger position is taken and the price moves higher. This is the basic principle of
[03:10] market movement, without which there is simply no fuel for the development of the movement. Let's say those who held on here placed their stops further away, more thoughtfully, to make sure they wouldn't get caught. Here, no one took profits,
[03:26] stop-losses were placed again, liquidity was collected, and the market moved on calmly. Why is this happening? Large capital mostly trades without any stop losses. Here, positions are being taken specifically on pullbacks, not somewhere here at
[03:40] one point from some super-lever that we have traded well, has several touches. That is, if we analyze this situation in detail, we have a whole zone formed here. Even if we look at it on a larger scale, we have identified this
[03:56] zone. Naturally, purchases are also made from it with the hope that the price will continue to rise. While large positions are placed not from this large positions are placed not from this zone, but just below this zone in
[04:10] those places where the majority places their stop-losses, even the most distant ones, large capital places its purchase orders. Here, no one worries whether the price will go up or down. The liquidation cards are taken in an elementary way. Finding
[04:24] them on the Internet won't be difficult. Liquidation card, for example, Bнаance, Liquidation card, for example, Bнаance, Bitcoin, USDT. That's it, here you can clearly see where stop-losses are, where to liquidate, and where to add positions to large
[04:37] capital. That is, on the current liquidation map we see that the big winners for Bitcoin will most likely be in this zone. That is, smaller players from this zone are now sitting in long positions, hiding their stop-loss orders behind
[04:51] the extreme, while the large player in this zone has not a stop-loss order, but a buy order. This is how liquidations happen. All these are lang stop-losses. When they are triggered, these will be sales,
[05:06] forced sales. Someone might close their position with their hands and sell it. And all these sales from us are bought by some whale, it doesn’t matter, a pod of whales, a whole group of whales. This is where they buy out. It is not necessary to cover the entire
[05:23] cutlet. If we simulate a dive into a position with large capital, the first order will be located in this zone, the second lower, and the third even lower. It would seem that this is where they should place their stop-losses, but no one
[05:38] places any stop-losses here. If a large item is loaded, they submit bids even lower, with the expectation that , for example, our price was 100,000, and from 100,000 it could be adjusted by even 50%. That is, the last limit
[05:54] can easily stand right at fifty, a round number. If the price had fallen further, all liquidity would have been washed out of the market, and stop-losses set by participants with any leverage would have been knocked out. The lower the price, the
[06:08] more liquidations. At the same time, a major player is calmly loading up and gaining a position. The price of three limited editions out of five was enough. The position was filled in three parts. Gorgeous. What happens next? Of course, unloading.
[06:23] That is, while we are here looking for trends, we are trying to catch the price by the tail. Here we have the following rule: the higher the price, that is, we had one impulse, in this zone, it is already dangerous to buy a second impulse. The higher
[06:38] the price goes, the more dangerous it is to buy, because the big guys start to gradually unload, selling their previously accumulated positions. Let's remove the unnecessary. Let's leave only the zone where we have a major player. And now we can
[06:53] calmly understand what happened to us on October 10th, which many did not survive and were subjected to liquidation. And it ’s not clear what happened here. Most traders have established an upward trend. The first trap is
[07:08] when we trade with curtains like these over our eyes. For example, a horse runs straight and looks, it has two leather pads specially placed here. If I'm not mistaken, she shouldn't look around, shouldn't get confused, should only look
[07:21] straight ahead. And if we trade with such overlays here, of course, we see one touch, a second, this is our daily time frame, a third touch. The price is rising,
[07:33] the chart is slowly rising, and will continue to rise indefinitely. We are expecting a higher movement from the third approach, from the third rebound . So what's the result? This movement does not occur. some short little feet, all shaved. This happens
[07:48] simply because the big guys who loaded up at this point, for example, at a price of 78,000, the average price gradually turned out to be already, when the price rose above 100,000, we already see a record 120,000, they begin
[08:03] to unload, selling their positions in parts at once. Naturally, they can't sell the whole pose. This is done gradually. That's why the price paints all these mean things for us, let's say. Where do we shave here? Next comes a breakout of
[08:20] the trend, a clear retest from the opposite side. A gorgeous entry point. We even went slightly into the plus. Bang! All these stop losses that were here were knocked out. We already had short stop losses. That is, again, as we have
[08:35] already found out, the big stuff started selling off in this place. But to realize the volume and sell everything, liquidity is needed. Liquidity in the market does not come out of thin air; it is formed with the help of participants. This is
[08:50] already a short deal. Here our trend has broken down. We retested it beautifully. Again, regarding strategies, many of them. The entry point is ideal. Short stop losses, meaning we have a sell position. Stop-loss - this will be a forced
[09:06] buy closing. Who is the right person to buy from? at the large plant that is being unloaded. That is, the price showed an attempt to recover, knocked out stop-losses here and a final sell-off, that is, forced purchases. This is where we got our final sales
[09:21] . Naturally, this does not mean that we cannot trade a trend break, a trend line breakout, or a retest from the opposite side. All of this is easily traded. If, for example, we noticed this movement during the day, then here
[09:35] local horizontal level formed. We switched to the hourly chart and saw that when the price broke through the daily support level, we had a local horizontal level on the hourly chart, and a short, clear entry point was visible on the retest already on the
[09:50] hourly timeframe. And the deal here could easily be taken away on the next approach, another one. Even this short movement on the daily timeframe could have been easily worked out on the hourly chart. That is, it is important to look at the schedule and
[10:05] accept it as it is. Don't wait for some kind of endless growth and try to jump into long positions until you're blue in the face, until you've knocked out all your stop-losses, but try to follow the market. That is, we have a breakout of the
[10:19] upward trend, a short movement can be worked out. In order to expect continued growth, we need to see, naturally, consolidation at the levels that formed on the daily chart. That is, we have a
[10:32] horizontal level here, some kind of zone has formed. That is, we have one parish, a second parish. We already understand that in order for the price to go up, at a minimum these barriers need to be overcome . That is, here the chart
[10:46] shows us the specific place where the big guys are leaving the market, that is, selling in parts, closing. Perhaps not the entire position, but some good sales are coming from this zone. Therefore, at this point there is no point in counting on longs. We
[11:02] observe during the day what happens next. Our price was right, but we were not secured for this zone. That is, beyond this zone, we see only tails on the daily time frame, the shadows of candles, which directly tell us that
[11:17] sales are taking place here. That is, the big guys continue to leave the market. And when we already see on the daily chart that the price has entered this zone, it merges from it again. We have a red candle that has engulfed the previous three candles. Of course, this is a signal that
[11:31] the sales are continuing. And this is our first liquidation zone. False trend breakout. That is, the trend seems to be approaching a break, but after that it tests again, corrects to its
[11:45] highs, and only from there does the downward movement begin. This is repeated on all timeframes. The only difference is that we have lower timeframes. The lower the timeframe, the more it is influenced by
[11:57] the timeframes above. That is, on the fifteen-minute chart, the fifteen-minute chart, all the higher time frames are already putting pressure on us from above, for example, the 4- day chart, the thirty-minute chart. And if some trend on the fifteen-minute timeframe hits the
[12:11] four-hour level, naturally, it will break. Therefore, in our analysis, we always take into account, even on lower timeframes, higher timeframes, but movement, trend formation, sideways movements, breakdowns, all of this is repeated in one way or another
[12:25] on all timeframes. Therefore, this takeaway, a kind of pattern, is drawn on all time frames. You can meet him. If we summarize and schematically draw what we have, that is, our standard entry point is taken out here
[12:40] at the breakout of the trend line. Even if there is some small retest from the opposite side, as we saw, this retest was shown right on the daily chart , the price may go down a little . Our goal, as always, is to reach the
[12:54] base of the trend. But before we go to this foundation, we can still easily experience this false takeaway. This means that the price will still be touching the previously formed maximum. In this place we have final sales of
[13:09] large capital, large players. They are finally exiting the market. And in this place there will be the most, let's say, favorable situation for opening a position, say, a short one. Understanding all these processes, the schedule becomes
[13:24] less scary. The most important thing here is to notice what is happening in reality. That is, don't pay attention to whether someone got shaved off, sold out, and so on, but calmly analyze, starting with higher timeframes,
[13:39] moving down to lower ones, working on some short, longer positions, or maybe some medium-term trading , long-term position sets for several months, which, in my opinion, is much easier to do, especially when there is no
[13:56] time for trading and daily participation in the market. That is, in this zone we understand that unloading is currently underway. They sold out here. There was a good short at the
[14:08] resistance point. And now, if we look at the situation realistically, as we understand, big capital is slowly starting to load up again. And for the big guys to build a good long position, they naturally need liquidity. Where
[14:22] to dive for this liquidity? Of course , under some strong, visible levels. Let's take the same day again. Level one, level two 74.052.
[14:34] Level one, level two 74.052. Yes, this is a scary deep correction, but if liquidity is needed to build a position, the price can easily dive into it. Not to shave anyone off or put out stop-losses, but
[14:47] simply to load a large position, yes, specifically on some liquidations, on futures, or on the spot, to get them to voluntarily
[14:59] sell their coins. The rules of the markets simply apply here. Some people place stop losses here, others place buy limits here . Below again a good level is visible. Some people have stop losses here,
[15:15] some people have limit pending buy orders here . Whether the price reaches here or not is irrelevant. If it happens, the big guys will buy at a good, favorable price, and as soon as we start moving up, they will slowly start unloading again and
[15:32] locking in profits. That is, it is an endless process that occurs in the market. And I'd like to remind you, guys, that for automated trading, so that you don't have to do anything manually, don't have to look for any deals, so that everything
[15:45] happens automatically, I use the Dragonfly trading robot. The bot trades for me, I monitor it. A tool proven over the years. There is a whole playlist about him on the channel. I'll also leave a video review of
[15:59] this trading robot in the description below the video. For those interested, the link is in the description. The second liquidation zone is the sideways movement. This is the point where the market does nothing, but most people think it is about to break out. Let's consider the
[16:12] break out. Let's consider the BNB coin, for example. Four-hour chart. On a daily basis, it is a little more difficult to find sideways movements, or rather, to see them clearly. Again, a schematic sideways movement is what we have . There are support and
[16:27] . There are support and resistance levels and standard sideways trading. when it has already formed, we have one touch, a second, we also found two points below, we drew a level. Next, we try to
[16:40] push to the next level from resistance to support and from support to resistance during the following approaches. But most experienced traders simply don't trade in sideways markets, because no one knows in advance where the price will ultimately end up
[16:56] . And here stop losses can be smeared. Firstly, the side part, especially in crepe, such a beautiful one, will not be drawn. There will be pins either up or down in any case. The sidewall will widen slightly. And here it is very
[17:10] important to understand how to calculate the final movement and where to enter. This is approximately what the sidewall looks like in reality. That is, our price does not continue to move downwards. Before this, we see that there was an active decline, and then we started to
[17:26] trample. That is, they didn’t go down, they seemed to show recovery, but then they merged again. Here they stabbed the resistance, merged again, and seemed to be going up. That is, in this lateral movement there are constantly some kind of hooks, extensions, first to one side,
[17:41] then to the other. It is best to do nothing in such a movement. We are trying to define the boundaries of this movement. We definitely look for breakouts at higher levels. As we can see, on the four-hour chart we had a spike, as
[17:56] if it was consolidating, but then the price came back with the next four-hour candle, completely absorbing the previous one, that is, simply a false breakout, the stop-losses were knocked out here and the price sank down. Ideally, we should wait until
[18:10] we have a clear exit from this range. As we can see, the price has moved significantly lower. And correction to this range. From here we are already looking for an entry point to continue the downward movement. These sideways movements will often have
[18:25] some kind of internal range. That is , we see that if we collect all the touches , we see that if we collect all the touches together, we have one, two, pin. Here the price almost went out of the range, but then returned again. Here the touch is the
[18:39] so-called outer range of the lateral movement. After exiting this sideways movement, we see that the price has retested it from the opposite side into this outer range. And as already discussed, on lower timeframes the same thing will
[18:54] form, only on a smaller scale. Here, just when we were retracing this sideways range from the outside, let's say, a small sideways movement formed here, which is no longer visible from four o'clock.
[19:08] From the watch, for example, it is also clearly visible. Again, at this point we see that the price is already moving sideways. It is impossible to predict where to enter here, where all this will end up. Here again, the same picture is repeated on a
[19:22] lower timeframe, as in the sideways movement earlier, they showed a kind of upward breakout, stopped-losses were knocked out, that is, no one is deliberately knocking out anything here, naturally, they simply collected liquidity to have the energy to move
[19:35] downwards, and from there they moved on. An adequate entry would be at a clear breakout of the sideways movement, when the price has already left the sideways range, traded behind it, showed a retest from the opposite side, and at this point a good entry into the
[19:52] trade would be. This, by the way, is a classic of the genre. In the previous video we also analyzed a similar deal that had been worked out. Let's do it schematically, to consolidate what is happening here, what kind of sideways movements we are talking about. Often we see sideways movements like these
[20:06] forming right at the top of a trend. So this is also a cool pattern. We may, of course, have a sideways movement somewhere in the middle of the chart, but what kind of picture often emerges. We have an upward movement. And here we have exactly the
[20:22] situation that we discussed last time, where discussed last time, where the inclination is broken through and then some stop-loss orders are taken out. For example, ascending, descending, it doesn’t matter. For
[20:37] example, we are now analyzing the upward trend, which often unfolds through exactly these kinds of sideways movements, which can be identified and wait for an exit from this sideways movement, a retest from the opposite side and a downward movement. That is, this is already a kind of
[20:53] pattern, a formation that you can remember when you mistaken. Again, let's not forget that there may be such pins in
[21:05] different directions. In our case, this sideways movement can have an internal range, an external one. I found this deal after searching and to make it clear how
[21:17] it looks on the chart. Here is a short position, the red arrow is entry, the blue one is profit taking. Here is our uptrend . Next, if we simply attach a slope like this, we will try to
[21:33] channel. Here, of course, it is a little awkward, but it can be done this way . That is, we have an impulse, a correction, an impulse. And here it seemed as if a breakdown occurred. Next we see a retest from the reverse side. Here the situation is
[21:48] a little different, because, as we analyzed, our price still reached the maximum and pinned it. But here is precisely that very sideways movement through which the price reversed to a downward movement. As we can see, here is our sideways trend, the
[22:04] exit from it is clear, that is, not just some kind of spikes, the price has already specifically exited it, retested it several times from the opposite side, and then I entered into a trade. Of course, the ideal would be to enter directly on the
[22:16] rete. It was through this formation that our trend, which had been upward, reversed. I also use the Bybit crypto exchange for my trading. This is the top crypto exchange in the world. It features a user -friendly trading terminal, spot
[22:31] futures trading, a variety of earning tools, Spot X, primarket, trading, copy trading, and trading bots. In the Banking section of Eorn you can open a crypto deposit. You can also open a payment card for yourself, just like a
[22:46] bank card. Only here you can pay for purchases with verification in the " Buy Cryptocurrency, P2P Trading" section. Buy Cryptocurrency, P2P Trading" section. You can top up your balance using a bank
[23:00] card or any payment system. description below the video. Don't miss your chance. And if you don’t understand something, go to the playlists channel. There's a whole Bybit learning playlist here. Bybit for
[23:16] beginners. In this playlist, you'll find answers to virtually all your questions about the Bybit crypto exchange, as well as a wealth of ways to earn money on it. So, the third liquidation zone is a deep
[23:30] pullback before the impulse. This is the moment when the market screws everyone who entered correctly, but too early. Here everything is much simpler. Let's take the daily timeframe. For us, let's assume, the latest impulse is Light eCoin. Also an old man in
[23:46] the count. During the day we again had this incomprehensible side range, which has both an internal channel and an external one. The graph sometimes
[23:58] seems to behave in an abstract way, but if you get used to seeing all this splendor, it becomes a little easier to analyze it. All. And, naturally, here we all expect that this was a
[24:12] long-term accumulation in the form of a lateral corridor. From here the price shot up. The elementary scenario is a retest from the reverse side, as we have already discussed, and a higher approach. And everything would be fine, but such a story didn’t happen to us. There was a retest
[24:28] , there was an attempt to restore, but the price did not go up. All this happens because we cannot predict the future. No trader can predict it . We can only learn to understand market movements on a larger scale, and
[24:42] not close ourselves off behind these curtains, like horses that need to run only horses that need to run only forward, because sometimes you get stuck, as I have caught myself doing more than once. For some reason, the market must
[24:55] grow, grow, and grow. Well, it doesn’t grow constantly, endlessly. And some despondency sets in; the market is always about emotions that you need to learn to
[25:07] work with, and first and foremost, it’s about psychology. If you don’t learn to work psychology. If you don’t learn to work with your vision, reactions, and constant experiences, you won’t be able to achieve good results. Emotions
[25:20] are normal, they are good, they are right, they protect us from certain things , but it is important to notice them and analyze them , just like a schedule. That's why I regularly monitor myself, take notice, and try to manage, so to speak, this
[25:35] process better and better. That is, right now, yes, we are undergoing a correction. Anyone who has gotten drunk in this place sits in despondency. But if we act more thoughtfully, let's say we have this takeoff, this upward impulse. And at the moment of this
[25:51] flight, if you are taking a position, for example, we are already talking about some medium term, it is important to ask yourself: will the price go up 100%, what is the probability of this event? Of course, the correct answer would be, well, at
[26:07] least 50/50. That is, the price can either go up or calmly roll down. Therefore, simply giving in to emotions, seeing this exit from a long sideways accumulation and entering into some serious purchase here directly from the
[26:23] current, this will often be unjustified. I am already telling you this from practice. Naturally, I have done this many times. It happens that the price really does continue to move higher, but then there is this deep correction that takes out
[26:38] this deep correction that takes out everything and everyone. If we add Fibonacci, we use Fibonacci here simply as a ruler. It's not some kind of magic thing, let's say. We are simply measuring the depth of the correction. That is, we had this
[26:52] whole upward movement, in which people jumped on board, bought, bought, bought. And then there is a drawdown to zero, the fifth level. That is, drawdown to zero, the fifth level. That is, imagine that if the position drawdown is 50% from the highs
[27:06] , most likely, here, firstly, if these are some short transactions, naturally, stop-losses are already knocked out. 60% there is absolutely no hope , but the price often shows a deep correction. This is 80 percent of the
[27:23] total movement. That is, the most courageous stop-losses that the price successfully passed. But then again,
[27:37] of course, in this range. That is, everything happens exactly like this on the market. Capital, liquidity, it doesn’t appear out of thin air. Money flows from hand to hand. That is, if someone had stop-losses here, someone definitely
[27:51] had buys here. The team of these people who caught the stop-loss here simply transferred liquidity, the money was transferred further into the position of the one who bought here. The moral of the story is that if we have some kind of prolonged sideways movement, especially on the
[28:06] daily chart, and then we see a good impulse breakout and want, for example, to load into some medium-term or long-term, it is important to understand that the price can easily correct almost at the base of this entire
[28:22] upward movement. 80-90 percent - that's easy. It is important to simply understand this, keep it in mind, and the most daring purchases are made in these places. By the way, this is October 10th again. Here are the
[28:39] most daring limited editions I took. Our third formation, a deep correction, looks like this. So, guys, today we practiced looking at the market from a broader perspective, analyzing higher timeframes, understanding the processes that
[28:54] occur there, and transferring this to lower timeframes. Naturally, we begin our analysis from the top down and discussed the mechanics of market movement, which is important to understand so as not to think that someone is constantly shaving someone else here, or that some
[29:09] kind of intrigue is being hatched. It's just how the market moves; for movement, good movement, liquidity is needed. This is the basic principle of market movement. So be sure to like, leave your comments, and subscribe to the YouTube
[29:24] channel so you don't get lost. Also subscribe to my Telegram channel, the link will be in the description under the video. That's all from me.
⚡ Saved you 0h 29m reading this? Transcribe any YouTube video for free — no signup needed.