
The Pattern That Ends Trends
51sDirectly addresses a high-pain trading problem and promises a solution, making viewers want to learn the pattern.
▶ Play Clip"Delivers on the promise of a pattern that ends trends, with clear examples, though it includes a subscribe plug and some repetition."
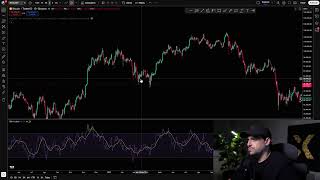
This video explains how to use the RSI indicator to identify trend reversals through divergence, helping traders avoid entering trades at the end of a trend. The presenter demonstrates the pattern with examples from Euro/USD and Bitcoin charts, emphasizing that divergence signals a potential end to a trend, which may lead to a reversal or sideways movement.
Understanding whether you are at the beginning, middle, or end of a trend is crucial for profitable trading. Recognizing the end of a trend helps avoid traps and bad entries.
The RSI indicator is used with default settings: period 14, overbought at 70, oversold at 30. The focus is on the RSI line's movement, not the overbought/oversold zones.
Divergence occurs when the price makes higher highs while the RSI makes lower highs (or vice versa). This indicates a weakening trend and a potential reversal.
RSI divergence from tops and bottoms within a trend signals that the trend is likely to end. However, the end of a downtrend does not guarantee an uptrend; it could lead to sideways movement.
In an uptrend on the Euro/USD daily chart, the price made higher highs while the RSI made lower highs, indicating divergence. This led to a sideways movement, not a reversal.
Before Bitcoin's all-time high in October 2025, the price made higher highs while the RSI made lower highs, signaling divergence. The price subsequently plummeted, confirming the pattern.
Divergence helps identify potential reversal points, not to enter a trade at that exact point, but to avoid entering a trend at the wrong time. It filters out bad trades and reduces losses.
The key to profitability is not increasing the number of wins but reducing the number of losses. Filter trades more thoroughly and analyze them intelligently.
RSI divergence is a powerful tool for spotting trend exhaustion and avoiding poor entries. By understanding this pattern, traders can improve their hit rate and reduce losses, leading to more consistent profitability.
What are the default settings for the RSI indicator?
Period 14, overbought at 70, oversold at 30.
00:39
What is RSI divergence?
When the price makes a higher high while the RSI makes a lower high (or vice versa), indicating a weakening trend.
02:33
Does the end of a downtrend guarantee an uptrend?
No, it may lead to sideways movement.
03:01
What is the main purpose of using RSI divergence?
To avoid entering a trade at the end of a trend, reducing losses.
06:33
What happened to Bitcoin after the RSI divergence before its all-time high?
The price plummeted.
05:32
Divergence Defined
Clearly explains the core concept of RSI divergence, which is the foundation of the video's strategy.
02:33Bitcoin Example
Provides a real-world, high-stakes example of divergence predicting a major price drop.
04:46Trading Philosophy
Emphasizes the importance of reducing losses over increasing wins, a key principle for traders.
07:12[00:01] now that destroys any trend. If you want to make money trading, one of the most important principles is understanding uptrend, a downtrend, at the end of a trend, in the middle, at the beginning, or in a
[00:14] sideways market? And if you find something that shows you that a trend is very likely to end, what happens? It will help you earn more money because you wo n't fall into traps. You won't
[00:27] in reality you're at the end of one. You won't think you're entering a sale intelligently, but you're at the end of a downward trend. So this reason, this pattern, this event that we have in the chart that I'm going to
[00:39] show you, which is using the RSI indicator, which is this indicator here, boom, which is here, this RSI indicator in the default configuration, okay? The index is default configuration, okay? The index is 14, right? And we have
[00:53] overbought conditions at 70 and oversold conditions at 30. Because what matters to us isn't the overbought or oversold region, it's simply observing the index, the little purple line we have. And my friends, you're
[01:07] like this video, please leave a like and subscribe to the channel. If you don't like it, you don't have to do anything. Next, is the trend ascending or descending tops and bottoms ? Descendants, right? Top,
[01:21] ? Descendants, right? Top, bottom. Top, bottom. Top, bottom. Hey, bottom. Top, bottom. Top, bottom. Hey, oops, top, bottom. Ready. After that, it reversed. Okay. Beauty. Take a look at the RSI.
[01:39] Here we had a background. The RSI was in the smallest region of easier to see. Look, it was down here, practically in the smallest region of all from this period.
[01:53] Then the market plummeted, forming another low with an RSI slightly higher than this other low here, but it 's practically aligned, right? Aligned or slightly 's practically aligned, right? Aligned or slightly higher. And then another background.
[02:08] And look where the RSI was, folks. Here, look. Okay ? This one was in this fund, and this other fund was the RSI. What does other fund was the RSI. What does that mean? We have an upward trend
[02:21] in the RSI index and a downward trend in the chart. One and a downward trend in the chart. One thing is going up and the other is going down. What does
[02:33] that mean? Do you know what this is called? Do you know what this is called? Divergence. RSI divergence from the tops and bottoms within a trend. This causes a trend to
[02:47] die out. This downward trend doesn't mean that, oh, it's going to turn into an upward trend. Beauty? Which in this case was very accurate, okay? The pattern was observed, and an upward trend began. But the end of a
[03:01] downtrend doesn't mean an uptrend will begin. It may be that lateral movement begins. People forget. Regarding this detail, it sideways movement, which is where many people get confused when the market is
[03:13] accumulating, okay? So I'm going to show you another example here so you can see it, okay? An upward trend has started here on the Euro/USD daily chart, and
[03:27] here on the Euro/USD daily chart, and we've had a top-top formation we've had a top-top formation , OK? And look at the RSI, top, top, top. Upward trend, one peak higher than the other, obviously. RSI,
[03:42] one peak lower than the other. Why? Divergence. This means that this upward trend that started here, and whose last peak was here, is
[03:54] coming to an end. And what did she start? This gave rise to that lateral movement. Now, whether it will go up or down from here on out , we don't know, but at least you would
[04:06] n't have done what you did. Let's suppose that if we were here in real time, oh, the upward trend, the market is going up, etc., I'll take a buy position here after the breakout of this high. But you look at the RSI, and you think, "Wait, it's practically
[04:20] divergent, should I buy this trade?" I am not going. So what do you do now? Get out of not going. So what do you do now? Get out of situations that would be traps. OK? I'm going to situations that would be traps. OK? I'm going to take and show you another
[04:33] take and show you another example that happened with Bitcoin, okay? Let's take a look here, I'll show you. Look how interesting show you. Look how interesting this movement is, okay?
[04:46] Look , , here we were in an upward movement in Bitcoin, going up, up, up before it hit its all-time high
[05:00] around October 2025. Going up, up, up, up, up. Beautiful, infinitely high, right? Almost hitting 100 CADOL. And it arrived at 100 Cadol. But look at this craziness, [laughs]
[05:15] looking at the RSI, this absurd upward movement, it had a peak in the RSI here, while on the chart it was here. Then there was a peak here on the chart, which was here. And then another peak here,
[05:32] one higher than the other here, and one lower than the other here. Damn. What does this indicate? Divergence, price will fall, right? It turned out as expected, it plummeted, OK? However, as I told you, it doesn't
[05:50] downtrend; it could be a sideways movement. So, he crashed here a few days later, right? Several days later, two, three months, he finally started a lateral movement. Oh, there was a slight tear up here.
[06:04] Beauty? But he did the same thing again, okay? He did the same thing again, look. thing again, okay? He did the same thing again, look. Top, top, and top. Oh, top, top, and top. One is shorter than the other, but here one is taller than the other. And so,
[06:18] my friends, it was inevitable. He started to move to the side and then fell. This pattern, occurring will most likely not just be lateral movement; it will eventually reverse . And that's what happened, it plummeted, right? So, it's important
[06:33] that you understand that when we look at the RSI, we can identify potential reversal points, not to enter a trade at that
[06:45] reversal points, not to enter a trade at that point, but to at least help you avoid entering a trend at the wrong time , okay? I hope you've , okay? I hope you've understood this pattern; it destroys
[06:58] any trend, and with this, you can trade any market because this information, this way of observing the chart, will undoubtedly help you stop making the wrong entries at the wrong time. That's why
[07:12] that you don't know when to enter, it's that you don't know when not to enter. There are
[07:24] reasons not to take a trade. You don't have to increase your number of wins, you have to increase your number of hits. You can keep it exactly the same. You just need to reduce the number of losses, filter your trades more thoroughly, and analyze them
[07:38] more intelligently. Did you like the video? Leave a like and subscribe to the video? Leave a like and subscribe to the channel. Yeah.




⚡ Saved you 0h 07m reading this? Transcribe any YouTube video for free — no signup needed.