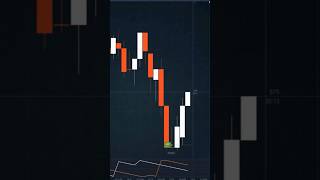

The 1 Candle Rule That Changes Everything
46sReveals a common mistake and a simple fix that promises to change trading results, triggering curiosity and a desire for a quick win.
▶ Play Clip"The title promises a fix for failing crossovers, and the video delivers a clear, actionable solution—though it's a basic strategy, not a revolutionary secret."
This video presents a simple yet effective trading strategy based on RSI crossovers on a 1-minute chart, emphasizing the importance of waiting for candle closes and using a filter to avoid false signals. The creator explains the exact entry rules and highlights common mistakes that lead to failures.
Use a 1-minute chart with a 14-period RSI. For a buy, wait for the RSI to cross above the 50 level and enter on the next candle. For a sell, wait for a cross below 50 and enter on the next candle.
Most traders fail by entering when the line touches the level. Instead, let the candle close and confirm the cross is complete before entering on the very next candle.
On a 15-second chart, the RSI constantly moves in and out of the middle zone. Use a stronger threshold: above 70 for buys, below 30 for sells, to confirm control and reduce trade frequency.
Avoid trading when the RSI lines are tangled in the middle (flat market), when there's a fake cross, or around major news events. Skipping is a valid strategy.
This is a fast setup on a short timeframe; losses come quickly. Test on a demo account across trending and flat markets before deciding if it fits your style.
The key to success with RSI crossovers is patience—waiting for candle closes and using filters like 70/30 to avoid noise. Test the strategy on demo first to understand its strengths and limitations.
What is the recommended RSI period for this strategy?
14
00:04
When should you enter a buy trade according to the strategy?
After the RSI crosses above 50 and the candle closes, enter on the next candle.
00:04
What is the most common mistake traders make with crossovers?
Entering when the line touches the level instead of waiting for the candle to close.
00:19
What filter does the creator recommend for a 15-second chart?
Use above 70 for buys and below 30 for sells.
00:45
When should you skip trading with this strategy?
When the RSI is flat, when there's a fake cross, or around major news.
01:11
Wait for Candle Close
This is the core habit that separates successful traders from those who fail, as it confirms the cross is real.
00:19Use 70/30 Filter
A practical adjustment that reduces noise and trade frequency, improving signal quality.
00:45Know When to Skip
Emphasizes that discipline and patience are as important as the strategy itself.
01:11[00:04] second candles. Expiry, 1 minute. Then search for a Rune, add it, set the period to 14, and leave everything else on default. Buy, wait for the crossover above the 50 level, and enter on the next candle.
[00:19] Sell, wait for the crossover below the 50 level, and enter on the next candle. 50 level, and enter on the next candle. That's it. Only the crossover matters. One detail though, and this is where most people go wrong. Don't enter the
[00:32] moment you see the line touching the level. Let that candle close first, and confirm the cross is complete. Your entry is the very next candle after that close. I know waiting feels slow, and I know it feels like you're missing the
[00:45] move, but that one habit will change your results more than any indicator setting will. Now the filter I promised you. On a 15 second chart, the reading moves in and out of that middle zone constantly. Take every 50 cross, and
[00:58] you'll be exhausted by the 10th minute. So I use a stronger version, above 70 for a buy, below 30 for a sell. Because 70 and 30 aren't the edge of control, they're the confirmation of it. The 50 cross tells you something is starting.
[01:11] started. Fewer trades, and that's the point. Also, know when to sit on your hands. Skip it when the lines are tangled in the middle, crossing back and forth. That's a flat market, and this needs direction, not noise. Skip it when
[01:24] a fake cross. And skip it around major news. There's no shame in skipping. The And let me be straight with you. This is a fast setup on a short time frame.
[01:36] Signals come quickly, and losses come quickly, too. Some of these will fail, and that's normal. So test it on demo first, across trending and flat markets, first, across trending and flat markets, and then decide if it fits your style.




⚡ Saved you 0h 01m reading this? Transcribe any YouTube video for free — no signup needed.