
AI Summary
The video explains why many traders fail when using supply and demand levels and introduces the SLC (Structure, Level, Confirmation) trading system as a complete framework. The presenter argues that supply and demand alone is insufficient and demonstrates how to integrate market structure and confirmation indicators to improve trading accuracy.
Chapters
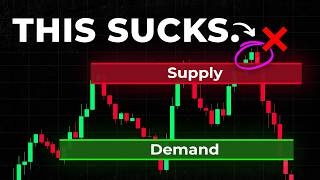
Traders often mark supply/demand levels, expect a bounce, but price breaks through, hitting stop loss. This leads to the belief that supply and demand doesn't work.
The presenter, a 7-year day trader, uses supply and demand as a core strategy but emphasizes that it's only one part of a complete system. Most traders fail because they use only one piece of the puzzle.
The SLC system stands for Structure, Level, Confirmation. Supply and demand is only the 'L' part. Applying the 'S' and 'C' parts can significantly improve trading results.
Structure refers to the market direction: uptrend, ranging, or downtrend. The SLC system only trades in uptrends or downtrends, not ranging markets. In an uptrend, only long trades; in a downtrend, only short trades.
Uptrend is higher highs and higher lows; downtrend is lower highs and lower lows. Use the latest price movement to determine structure, not old patterns.
Trade on lower time frames (1-15 min) but identify structure on a higher time frame like the 1-hour chart. Example on Nasdaq futures shows an uptrend on the 1-hour chart.
The 'L' part involves finding strong levels where price is likely to react. Supply and demand levels are used here. Demand levels are areas of aggressive buying; supply levels are areas of aggressive selling.
After identifying structure on the 1-hour chart, drop to the 1-minute chart to find levels that align with the high time frame structure. In an uptrend, only look for demand levels.
Confirmation involves stacking additional factors to confirm the trade. The video uses the Stochastic indicator as confirmation. The blue line must break below oversold and cross back up when price taps the level.
Once aligned, enter a long position with stop loss slightly below the demand level and take profit at 2R. Example shows price hitting the target perfectly.
A free checklist is offered to help traders follow the SLC system step-by-step, preventing mistakes and ensuring only high-probability setups are taken.
The SLC trading system provides a structured approach to trading supply and demand levels by incorporating market structure and confirmation, which can transform trading from random guessing into a repeatable process.
Mentioned in this Video
Tutorial Checklist
Study Flashcards (8)
What does the SLC trading system stand for?
easy
Click to reveal answer
What does the SLC trading system stand for?
Structure, Level, Confirmation
00:55
What are the three types of market structures?
easy
Click to reveal answer
What are the three types of market structures?
Uptrend, ranging, and downtrend
01:35
In the SLC system, which market structures are traded?
medium
Click to reveal answer
In the SLC system, which market structures are traded?
Only uptrend and downtrend; ranging markets are not traded.
01:49
How do you identify an uptrend structure?
easy
Click to reveal answer
How do you identify an uptrend structure?
Price forms higher highs and higher lows.
02:14
What is a demand level?
medium
Click to reveal answer
What is a demand level?
An area where aggressive buying previously took place, marked by a sharp upward move.
04:30
What is the confirmation used in this video?
medium
Click to reveal answer
What is the confirmation used in this video?
The Stochastic indicator: the blue line breaks below oversold and crosses back upwards.
07:38
Where is the stop loss placed in the example trade?
easy
Click to reveal answer
Where is the stop loss placed in the example trade?
Slightly below the demand level.
08:05
What is the take profit target in the example?
easy
Click to reveal answer
What is the take profit target in the example?
2R
08:05
💡 Key Takeaways
The SLC System
Introduces a complete trading framework that combines structure, level, and confirmation, addressing the common pitfall of using only one element.
00:55Only Trade Trending Markets
Emphasizes the importance of market structure in determining trade direction, avoiding ranging markets to increase probability.
01:49Definition of Supply and Demand
Provides a clear, actionable definition of supply and demand levels based on aggressive buying/selling, which is foundational for the strategy.
04:30Stochastic Confirmation
Demonstrates a specific confirmation technique using the Stochastic indicator, adding a layer of validation to the setup.
07:38Trade Execution Example
Shows a complete trade from entry to take profit, illustrating the practical application of the SLC system.
08:05Full Transcript
[00:02] I'm sure you've marked a supply or demand level before. You waited for price to touch the level, and once it does, you enter a trade and expect it to bounce. But instead of bouncing, price instead breaks right through hitting
[00:14] your stop loss. Then you think supply and demand levels do not work. Now, before you get mad at me in the comments, I also trade supply and demand levels myself. In fact, it's actually one of the core strategies I use that
[00:27] has made me consistent profits after day trading for 7 years. So, how did I traders who trade the same strategy aren't? The reason most traders fail when trading supply and demand isn't because they're trading it wrong, or
[00:41] correctly. It's because they're only using one piece of the puzzle. In reality, supply and demand is just one part of a complete trading system. If you want to become a profitable trader and successfully trade supply and
[00:55] demand, you need to apply the rest of the framework that makes these levels actually work. And so, the exact trading system I'm using is called the SLC system, which stands for structure, level, confirmation. And if you only
[01:09] trade supply and demand levels, you're only using the L part of the trading system. But the good news is, it means you've already got one part sorted out. So, all you need to do is apply the S and C part, and you will see significant
[01:22] improvements in your trading results. So now, I'm going to show you how to trade the SLC trading system. First, we start with the S part, which stands for structure. So, what is structure? Structure simply means the direction of
[01:35] the market. Now, there are three types of market structures: uptrend, ranging, and downtrend. In the SLC trading system, we only trade if the market is in an uptrend or downtrend, which means we don't trade during ranging markets.
[01:49] Now, the reason we must determine the structure early on is because it will determine the direction of our trades. If the structure is in an uptrend, then we only look for long trades. And if the structure is in a downtrend, then we
[02:02] only look for short trades. An analogy for this is like swimming in a river. If the current is moving downstream, and you decide to swim against the current, not only will you move slower, but you'll also use more effort trying to
[02:14] the current, you'll end up moving faster, while also using less effort momentum of the river. Identifying the structure of a market is quite simple. In an uptrend structure, you will see price forming higher highs and higher
[02:30] lows. And in a downtrend structure, you will see price forming lower highs and lower lows. So, let's look at a real example of this. Here, I'm on the Nasdaq futures chart. First, you want to start by identifying the high time frame
[02:43] structure. In the SLC system, we like to trade on lower time frames, like the 1 to 15-minute chart. But specifically for the structure part, we want to go up to a higher time frame, like the 1-hour chart, and identify its structure there.
[02:57] chart, and identify its structure there. So, let's switch to the 1-hour chart. forming an uptrend. It made a clean upward move, then a slight pullback
[03:09] here, and price consolidated for a bit. But eventually, price continued pushing higher and formed new higher highs. So, the current move is clearly an uptrend structure. Now, it's important that you determine the structure based on the
[03:22] latest price movement, because if you zoom out, price was previously forming a downtrend structure. But recently, it reversed and started forming an uptrend. So, we use the latest price move as our structure. Once the recent structure is
[03:36] identified, we move to the L part in the SLC system, which stands for level. Now, before we continue, if you want to learn more about the SLC trading system and apply it to your trades, I created the free SLC execution blueprint that you
[03:50] can download for free. It's basically a checklist that walks you through the entire structure level confirmation process step-by-step. So, whenever you're about to enter a trade, you can quickly go through the checklist to make
[04:03] sure the setup aligns with the SLC system. You can download it for free in the description below. Now, back to the L part. So, the goal of the L part is we want to find strong levels where price has the highest chance of reacting.
[04:17] Within the SLC system, there are actually multiple ways to identify these strong key levels, but in this video, we're using supply and demand. Now, here's a quick explanation of what supply and demand levels are. To put it
[04:30] simply, these areas show where aggressive buying or aggressive selling previously took place. To find a demand level, you simply find a moment where price forms a sharp upward move. The area before the sharp move happened is
[04:43] what we call a demand level, and you can mark it with a rectangle. So, because the level represents aggressive buying previously took place, it means next time, if price returns to that level again in the future, we can expect
[04:56] buyers to step in at that demand level, which is going to push the price up. It's the same thing for supply levels. To find one, you wait for a moment where price forms a sharp downward move, and the area before the sharp move happens
[05:10] is what we call a supply level, which you can mark with a rectangle. Because this area represents aggressive selling that previously took place, it means the next time price steps into that supply level, we can expect sellers to push the
[05:23] price back down again. So, that's the logic behind supply and demand levels. to identify the supply and demand levels there. Here, we're still on the 1-hour time frame after we've identified the
[05:36] structure earlier. So, now we go down to the 1-minute chart and find the levels And remember, the levels that we want to find here must align with the high time frame structure we identified. This is so that we don't clutter up our charts
[05:51] and draw random levels that we end up not using. So, since the high time frame structure was an uptrend, we are only interested in finding demand levels. So, let's find the recent demand levels in this chart. Here, we can see a sharp
[06:04] upward movement, which signals that there was strong buying pressure in that area. What we want to do is take the initial candle right before the upwards move happens, and that will become our demand level.
[06:17] Now, it's also important that we draw the level exactly before the sharp upwards move occurred. The reason I didn't draw levels in this zone or this zone is because the upward moves there are not significant enough. They're just
[06:30] small bumps, which means the buying strength wasn't that strong compared to this major move here. Once the level is identified, we move to the C part of the SLC system, which stands for confirmation. So, this is the last part
[06:44] you have to do before entering a trade, but is also the most important. To put it simply, confirmation is when we find additional factors that confirm our potential trade. In other words, we're trying to stack as many factors as
[06:58] possible before entering the trade to make sure that the setup actually has a high probability of working out. Now, again, there are many types of confirmations that we can use when trading the SLC system, and in the next
[07:10] episodes, I'll slowly reveal them to you one by one. But, to keep things simple, the confirmation we're going to use for this video is using an indicator called the Stochastic. To apply it on your charts, just go to the indicator
[07:24] section, type in Stochastic, and click this one. adjust them to match these values because I've found that these values tend to work the best. So, here's the specific confirmation I'm looking for.
[07:38] As price taps into the demand level, the blue Stochastic line needs to break below the oversold line, which is this line, and then crosses back upwards. This analysis from the indicator basically shows that price is becoming
[07:52] overextended and is starting to show signs of a potential bounce. So, we're simply adding another analysis to confirm that the bounce is actually happening. And this small difference alone can drastically improve the
[08:05] accuracy of your trades. And once everything is aligned, we open a long position. The stop loss goes slightly below the demand level, and we can set a take profit target of 2R. And in this example,
[08:17] price moved up and hit our take profit level perfectly. So, you can see just how powerful the SLC trading system is. All you have to do is follow a simple trading framework, and it can completely change the way you approach the market.
[08:30] understand these concepts when watching my videos, but when you actually sit down and begin trading them yourself, everything can become messy. You might forget some steps, rush into trades, or even deviate from the SLC system. In the
[08:45] end, you'll end up losing trades yet again and drain your account. So, to solve this problem, I created something that can help you. It's called the SLC execution blueprint. Inside this blueprint, you'll find a checklist that
[08:58] walks you through the entire SLC trading system step by step. So, before entering this checklist to make sure you're following each step of the SLC system correctly. Starting from the structure, level, and confirmation. This prevents
[09:13] you from taking bad setups and forces you to only take trades that follow the system. And once you start applying the SLC system, trading will stop feeling like random guessing and becomes a more repeatable process. So, if you want to
[09:26] implement the SLC system in your own trades, click the link below and download the free SLC execution blueprint. Use it on your very next trade. So, that's it for today. I'll see you in the next episode.



