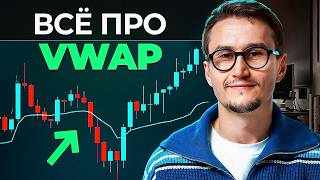

Why VWAP Beats Every Moving Average
40sExplains the core edge of VWAP—volume-weighted supply and demand—in a way that immediately clicks.
▶ Play Clip"Delivers a solid VWAP guide with formula, settings, and live trade examples, even if the 'Americans love it' promise isn't backed by proof."
The video explains the VWAP (volume-weighted average price) indicator: what it is, how to set it up in TradingView, how to interpret its lines, and how to use it to identify trends, flats, and trading entries. The creator shares a simple formula, the importance of the reset period, and two classic strategies with a live example on dollar-ruble futures.
VWAP shows the average price and average volume, revealing where the volumes and capital of large market participants are directed.
The indicator is built into virtually all trading platforms, from premium terminals to cheap ones like TradingView, so no additional software is needed.
Unlike simple moving averages, VWAP weights prices by volume, and volume represents the supply and demand passing through the market.
VWAP = the sum of (transaction price × transaction volume) divided by the total volume. It is a volume-weighted average price.
Open the Indicators menu, search for 'average weighted price by volume' (VWAP), and add it to the chart.
In the settings gear, choose a period such as 'Session' or 'Week'. The indicator resets and starts fresh at the beginning of each selected period.
The middle blue line is VWAP; the upper boundary is VAH (value area high), the lower is VAL (value area low), and additional lines represent further deviations from the average.
The larger the volume in a trade, the larger the deviation from the VWAP line; bigger trades influence the indicator more.
After a reset, avoid analyzing the indicator for the first 2–3 hours of a session (or the first 2 days of a weekly period) so it can accumulate enough volume data.
If the middle line is straight or stays in a range, the market is flat; if it deviates upward or downward, a trend is underway.
In a trend, take rebounds from the upper/lower boundaries in the direction of the trend. In a sideways market, trade a return to the center line.
A sideways trade with a 1:7 risk-to-reward ratio is shown: enter after a reversal pattern, stop beyond the impulse, and take profit at the middle line. Sideways markets are hard to trade and often manipulated by big players.
What does VWAP stand for and what does it show?
Volume-weighted average price; it shows the average price of trades weighted by their volume.
02:06
What is the formula for VWAP?
It is the sum of (price × volume) divided by the total volume.
02:21
What are VAH and VAL?
VAH is the upper boundary of the value zone and VAL is the lower boundary; they are deviations from the VWAP line.
04:01
When does the VWAP indicator reset?
At the start of each selected period — e.g., the beginning of a session or a week.
03:06
How can you distinguish a trend from a flat using VWAP?
If the middle line is straight/range-bound, it's flat; if it deviates up or down, it's a trend.
07:20
Why should you wait 2–3 hours after the session starts before using VWAP?
Because the indicator resets each period and needs time to accumulate enough volume data to be reliable.
06:20
What is the recommended strategy in a trend?
Take rebounds from the upper or lower VWAP boundaries in the direction of the trend.
09:41
What risk-to-reward ratio was shown in the sideways trade example?
1:7.
12:55
Why does VWAP account for supply and demand?
Because it weights prices by volume, and volume reflects the supply and demand flowing through prices.
00:57
VWAP is a volume-weighted average price
Provides a clear, simple definition that is the foundation of the entire video.
02:06Reset period controls the indicator
Explains a critical setting that changes how to interpret the indicator across sessions or weeks.
03:06Straight line = flat, deviating line = trend
Gives a fast, visual way to identify market phases without calculating supports and resistances.
07:20Trend and sideways strategies
Summarizes two distinct trading approaches so viewers can apply VWAP immediately.
09:41Sideways markets are created by big money
Warns that range-bound action is designed to take money from retail traders, adding a risk-management insight.
12:55[00:02] the volumes and capital of large participants are directed. Today you will learn about an indicator that perfectly shows where volumes will go. It shows the average price and also indicates the average volume. Together with your
[00:16] market analysis, you will be able to close such, such and such trading days. I have been trading in the markets for 18 years, since 2008. And I would call this indicator one of the best. And most
[00:28] importantly, it exists. in any trading terminal. What I don’t like about the VWP indicator is that it is available in any trading terminal. From terminals for $1,000 a month to ultra-budget ones like Trading
[00:43] Viu, it will be everywhere. It has already become such a terry, simply terry classic that can be found in any trading terminal. This means that you do not need to install any additional terminals to access this
[00:57] indicator. The second advantage is that it takes into account supply and demand. Most indicators simply show the average price. Well, for example, there is an average for a certain period. Here, weighing is also done for volume. And
[01:10] volume, in turn, determines the amount of supply and demand that goes through prices. This means that this indicator takes into account supply and demand. А поскольку спрос и предложения влияет на рынок, и только оно влияет на рынок,
[01:24] этот индикатор неплохо показывает настроение участников рынка, а самое главное, он показывает, куда заходят капиталы, что, конечно, даёт вам возможность определения тренда и флэта. With this indicator, a beginner
[01:37] can perfectly interpret a flat trend without calculating minimums and maximums. And of course, this indicator, like any other, gives you price areas, places where you can identify good entry points with high
[01:52] potential. Essentially, you will be able to get a ready-made trading strategy based on this indicator. True, as in that phrase, all that remains is to attach the monitors. What is the essence of this indicator? It is essentially a
[02:06] volume-weighted average price. Vivo is calculated by multiplying the price of each transaction by its corresponding volume. And the sum of these values is divided by the total volume. The formula looks like this . The price is multiplied by the volume and
[02:21] divided by the total volume. The beauty of this indicator, of course, is in its simplicity. To add the indicator to the chart, I show an example in TradingQue. But terminal. You need to press the indicators. After this, enter the
[02:37] average weighted price by volume in the search. This is what it's called here. In general, ideally , it would, of course, be called VV in English. There is also an indicator with the same name VAP, but it was already designed by some other
[02:51] users, and we don’t know what formula they put into it. Therefore, it is indicator, the average price by volume. After you have added the indicator to the chart, you need to click here, then click on the
[03:06] settings gear and select the time period. The time period is the start from which the indicator will be reset. If we select session, then at each session start, as you can see, the indicator starts its calculations again, that is, the cycle
[03:20] is updated. If we set a period in this indicator, for example, a week, then every week this indicator will reset and start from the very beginning. This is an important parameter. We will return to this repeatedly throughout this
[03:34] video. For now, it's important to remember this. We might still need this in the future. Смотрите, дорогие друзья, чтобы быть максимально эффективным и зарабатывать на финансовых рынках, в особенности, если вы занимаетесь трейдингом, если вас
[03:47] трейдинга, как начать трейдинг на московской бирже, в частности, вы должны понимать, что рисует этот индикатор. The average weighted price by volume is located here with the blue line, that is, it is in the middle.
[04:01] Of course, you can choose any color. Next we have deviations from this average line. They form the boundary Vah, which is also called the upper boundary of the Vah, which is also called the upper boundary of the value zone, and VAL, which is also called the
[04:16] lower boundary of the value zone. Besides the valves and the middle line, there are also other displays where you add another line, another line, another line. Again, this is all a certain deviation from the average
[04:30] line. The most important line, of course, is the most important line, namely the middle line. All other lines are simply deviations from this average. The formula of this indicator is very simple. The larger the volume in a trade, the greater the
[04:44] indicator deviation will be. Well, or the greater the price movement. The smaller, the less, respectively. What is meant and why is this indicator so popular in the West, in particular ? Let's imagine this situation. Here we have,
[04:57] for example, a downward movement. After this movement, the movement is upward. And our average price, for example, during this process is 2 rubles. If this is, for example, a Russian stock, that is, the stock fell, after which the stock rose and our average movement
[05:11] was 2 rubles. Usually, a moving average would have drawn these same 2 rubles on the chart. That is, it would show the average price for these two candles. But there is a main parameter - volume. If, for example, we have more volume in a
[05:27] bearish candle, then there will no longer be 2 rubles here. Here it can be zero or -1 depending on what volumes are passing. That is, the greater the volume, the more influence these prices have on the indicator. And this is an important
[05:41] advantage, because if capital comes in , then, naturally, this capital of course, the indicator will show us this. Before we go any further, please subscribe to my channel. This is very important, especially when
[05:56] you won’t get this information anywhere else, only on my channel. You have to search for it bit by bit with the help of some artificial networks and so on. And here I give you everything, essentially, openly and tell you how it
[06:08] actually works. So I hope you appreciate it. And please subscribe to the channel. It's free. Okay, how do you use this indicator now? First, it is necessary to clarify one more time. Each period the indicator is reset. Therefore,
[06:20] we do not analyze this indicator during the first 2-3 hours after the start of the trading session and the 2-3 hours after the start of the trading session and the first 2 days after the start of the weekly session. It is important to make a clarification here. These 2-3 days, 2 days, if it’s,
[06:36] I’m taking all this from my head. That is, there are no scientific studies here that directly prove that we wait for 2 hours and so on exclusively there . While you are a beginner, stick to these values. If you
[06:50] find this interesting, do some analysis and some statistics, perhaps market you will be trading in. Because I suspect if it's a more volatile instrument, then we do it for longer . If it is a less
[07:05] volatile instrument, then we do less time. How to identify flat trends using the Vivab indicator? If the average line deviates, you are in a trend. If the center line is straight, then you are in a flat. I will show an example on
[07:20] dollar-ruble futures. Look, our middle line is straight or is in the same range. We have sideways movement in the markets . Our middle line deviates upward. We have a trend in the market.
[07:33] movement, after which the average line began to rise. And we have a trend. The same goes for the side section of the market. After this, the average line changes and we have a trend. It's easy to see that we're experiencing a sideways movement.
[07:49] the middle. Then the middle line starts to rise, and we have a bullish trend forming. It is important to make a clarification. As you can see, here I have made a time period, trading session. Если я поставлю неделю, то нужно делать поправку на то,
[08:05] что неделя - это высокий временной интервал, поскольку этот индикатор не пересчитывается в зависимости от таймфрейма, и это не минус, а плюс этого for example, the hourly chart, I will see the same lines, that is, nothing
[08:19] depending on the time frame, and this is a huge plus of this indicator. But a certain correction must also be made. For example, here I had a straight middle line, but at the same time, if you pay attention, the market had
[08:33] small upward or downward trends. And it seems that the indicator is showing incorrectly. Actually it shows correctly. You just need to make an adjustment that this is a long time interval, that these are long periods, weekly periods.
[08:45] And, of course, here the sideways sections of the market are represented on a small time frame, five-minute time frame, and they represent some kind of small trends. Но если мы с вами перейдём, например, на часовик и обратим своё внимание именно на часовик
[09:00] и посмотрим на тот же самый период на часовике, обратите внимание, у нас здесь происходит боковой участок рынка и линия у нас прямая. a deviation occurs, and we begin to see some trends. Or here, for example, here again on the
[09:14] hourly chart we see a sideways market section, and the indicator indicates this. But at the same time, within this hourly period there may be full-fledged trends that can last the entire trading day. For example, here we see a small
[09:28] sideways wave, but in fact this is an entire trend day. Now I will tell you the standard classical strategies, but you should know that there are actually many of them, and perhaps some of you will invent something of your own. So, that's the standard strategy. In a
[09:41] trend, we take rebounds from the upper and lower boundaries, but depending on what kind of trend it is. In the sideways movement we are working to return to the center line. Let's look at a small example. Here we have the beginning of the trading
[09:54] session. For some reason, he calculates the start time for the Moscow Exchange at 19:00, that is, according to the start time of the evening session. But fortunately this does not interfere with the analysis in any way. At this has been trading for several hours, meaning that some data has appeared for
[10:08] display, and we see that our indicator is starting to rise. Based on this, we understand that we are in a trending part of the market. This means that we need to take rebounds on the movement towards the upper border. We see how our market is
[10:22] growing, but it doesn’t yet provide any entry points. And here we have our first entry point. Here we hit the border. Now we need to see the movement in the see a reversal pattern. What could be a reversal pattern? In total, we
[10:36] have several variants of the reversal pattern. The first option is when we see a small candle here with a small body and an upward impulse, which will seem to cover the previous candle. But it can be done without this. We may
[10:50] just see a big momentum move upwards. And then we enter on this impulse. Please note that we are trading on a five-minute basis. This means that the big candles that look big to us now are not actually that
[11:03] big. We see that we are getting momentum. Here we open a long position with a stop for this impulse and a take profit twice as large. We see how in this case the indicator is already starting to straighten out little by little. This means that we are
[11:19] moving from a trending area into a sideways, flat area. And here we need to be extremely careful, extremely accurate. However, at the same time, we see that the indicator is still growing steadily. That
[11:31] is, it is not completely straightened, it has a slight tilt. This means that we understand that we are continuing to be in the trend, and we are again moving upwards. Let me draw your attention to the fact that here we have the pattern that I indicated, a model of
[11:45] range narrowing followed by expansion. That is, a small downward movement and subsequent upward impulse movement . То есть, если бы мы, например, не заходили вот здесь, мы бы заходили вот здесь, чтобы поймать хорошее
[11:59] движение в боковике, чтобы действительно на боковике заработать, вы это не сможете поймать в рамках одной торговой сессии. Well, as if you could with some deviations, there, shortcomings and so on. If you are a beginner, you most likely
[12:11] honest. For this reason, you need to set Vivaup to a weekly chart. By setting up a weekly chart, you will be able to catch big moves. We are now in the side section of the market. That is, we have a middle line,
[12:26] it moves clearly sideways, there is an upward blow, and now we need to wait for a reversal pattern. And then this reversal pattern emerges. That is, we have an upward movement, a narrowing of the range, that is, the appearance of small
[12:39] candles with tails pointing upward and a downward impulse occurs. We enter into a sale here, place a stop order for this model, and take profit at the middle of the line. Please note that I have a risk to reward ratio of 1:7. This is normal for the
[12:55] sideways market. And then the market reaches our take profit. Please note that trading in a sideways market is one of the most difficult ways to trade and make money in the financial markets. Therefore, if you have
[13:09] the opportunity not to trade in a sideways market, it is better not to trade. Trade some other part of the market, perhaps some other financial instrument, because sideways movements are mostly created by big money. in order to
[13:21] take money from hamsters. And I think you don't need it. If you're new where to start, that's not a problem. I have a separate course, it’s free, it’s called Start in Trading Without Deception. This is not an infestation
[13:36] warm-up. I promise there won't be any warm-ups there at all. We've simply compiled the most powerful lectures on financial markets to help you get started an account, which platform to trade on, what
[13:49] market mechanics are, how candlesticks are formed there, and so on. That is, all the to trade. Moreover, four have been tested and that actually work. Please scan this
[14:03] QR code and check out this training course. Everything is absolutely free. I will not remember you. In general, take a look, if you like it, buy paid training courses, of course, we have them. You won't like it, but you'll say: "[ __ ] you
[14:18] won't like it, but you'll say: "[ __ ] you , Atyom Anatolyevich, I won't be offended.



⚡ Saved you 0h 14m reading this? Transcribe any YouTube video for free — no signup needed.