

Why Accumulation Creates Supply & Demand Zones
43sVisually explains the core concept of accumulation and how it forms key zones, which is foundational for traders.
▶ Play Clip"Delivers on the promise of explaining why zones might not work, but includes some filler and repetition typical of trading tutorials."
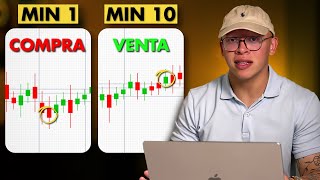
This video explains the law of supply and demand in financial markets, focusing on how to identify and trade supply and demand zones. The presenter distinguishes these zones from order blocks and demonstrates a practical entry strategy using higher and lower timeframes.
Price movements are driven by supply and demand; every buyer needs a seller, and periods of accumulation indicate indecision and potential future moves.
In forex, buying and selling represent exchanging one currency for another; price movements reflect supply and demand for the pair.
When there are few participants, the price accumulates. Strong movements occur when buying or selling pressure increases.
An 8-hour accumulation period from 4pm to midnight shows price moving sideways, indicating a lack of direction.
The more of a product, the cheaper it becomes; the less, the more expensive. Participants buy low to sell high.
Supply/demand zones are accumulation areas where there were few transactions. The price often returns to these zones to activate pending orders.
Enclose the accumulation candles in a small square and extend it to the right to create a zone for future price reactions.
Accumulation zones capture a broader area than order blocks; sometimes the price may not reach the last opposing candle but does reach the accumulation zone.
Use 5-minute or 15-minute timeframe to wait for entry confirmation: strong candle, engulfing pattern, or structure break after price touches the zone.
Identify supply/demand zones on the 1-hour timeframe, then use lower timeframes for precise entry.
Accumulation zones have no suppliers or demanders initially; when price returns, new transactions revive the area, causing strong moves.
Mastering supply/demand zones requires understanding accumulation areas and using proper entry techniques. By combining higher timeframe zones with lower timeframe confirmation, traders can improve their trading consistency.
What is an accumulation zone in trading?
An area where the price moves sideways with no clear direction, indicating a lack of buyers and sellers.
02:12
How do you mark a supply/demand zone?
Enclose the accumulation candles in a rectangle and extend it to the right.
05:08
What is the difference between a supply/demand zone and an order block?
A supply/demand zone captures the entire accumulation area, while an order block is a single last opposing candle.
07:39
What timeframe does the presenter recommend for identifying supply/demand zones?
The 1-hour timeframe.
08:09
What entry confirmation does the presenter use?
A strong candle, engulfing pattern, or structure break on the 5-minute or 15-minute timeframe.
08:36
Where should stop loss be placed for a buy entry in a demand zone?
Below the demand zone.
10:09
Why do supply/demand zones often cause price reactions?
Because they were dead areas with no transactions, and when price returns, new orders get activated.
13:53
Accumulation Indicates Indecision
Explains that sideways price movement signals a lack of market participants, which often precedes strong moves.
02:12Supply/Demand Zones vs Order Blocks
Clarifies the distinction, emphasizing that accumulation zones are broader and more reliable.
04:16Entry Confirmation on Lower Timeframes
Shows practical method to combine higher timeframe zones with lower timeframe entries.
08:36Why Zones Work: Reactivation of Dead Areas
Provides logical explanation for the effectiveness of supply/demand zones.
13:53[00:01] trades because they don't know about supply and demand, forgetting that the law of supply and demand is basically a law, as its name demand, you're possibly losing deals and you don't know why. So
[00:15] to explain how supply and demand works in the market and how you can take advantage of it. Every time you see the price go up and down, it's the price is driven by a trend or
[00:29] structure. When you observe periods where the price drops sharply, then starts to accumulate, then drops all of this has an explanation. I want you to understand, from a
[00:42] financial perspective, that every time the price moves down or up, it's understand that when we are talking about the euro, the dollar, we always have to emphasize the division. When we make a purchase,
[00:55] we are buying one currency with another, paying with another, and when we make a sale, we are buying one currency paying with another. In other words, in some cases we are buying dollars by paying with euros and in some
[01:08] cases we are paying euros by paying with dollars. In both cases we are basically buying. The thing is, within the market it's represented as buying and selling. When the price goes down, we sell; when it goes up, we
[01:20] buy. But you have to keep in mind that this is a representation of the price of two assets, not just one . So, in both scenarios we are buying, and every time we talk about buying and selling, there is
[01:32] supply and demand. For every buyer there must be a seller. And this is represented within the graph as follows. When there is a lot of buying or a
[01:45] lot of selling, the price will have a strong downward or upward movement . When there are no purchases and when there are no sales, that is, when there are limited participants, when there are not many, the price accumulates, but
[01:57] again, the price goes up, immediately people sell again, the accumulation. This is represented within the price as movements or accumulations. If we start analyzing the price from here, let's look at this point.
[02:12] Here we observed that at 4 pm the price began to accumulate for several hours, until midnight, 8 hours of accumulation. This is an accumulation because we observe that the price is literally neither going up
[02:25] nor down, it is going up a little bit and then going down a little bit again. This is accumulation. All this movement here is price delivery movement. This enough participants. When there is movement, there are enough
[02:39] participants. Generally, after these movements, the price tends to make certain retracements because when the price drops too much, it reaches a point where it is retracement, which we will call a discount, so that new offers can come in,
[02:55] and with those new offers, new participants interested in buying these offers. This is the law of supply and demand. The more of a product there is, the cheaper it becomes. The less of a
[03:07] product there is, the more expensive it becomes. Generally, participants want to buy low to sell high, and when we observe these accumulations it is because there is still no money within the market. Once we observe these
[03:19] direct movements, the first thing we will observe are retracements. These movements are followed by setbacks, setbacks, and more setbacks. And all these pullbacks, the objective is to find areas of supply and demand, areas where the
[03:35] price has reached or may reach and cause a movement, areas where buyers and sellers within the market, are interested in continuing to buy and sell. And we will generally
[03:49] find these areas in overblogs or at high points. Observe the following. This is a Thursday. On Thursday we observed that there is an accumulation at this peak, at this high. After this accumulation, this high, the price moves
[04:02] away and then returns to that accumulation. We are going to identify the supply and demand zones as the accumulation that exists goal with these supply and demand zones is for the price to
[04:16] return to those zones in the future, and for us to use them as strong zones that create movement. This here is a price buildup, and this price buildup is a supply and demand zone; "supply and demand"
[04:29] supply and demand zone; "supply and demand" would be "SD supply and demand" in English. because it's an area where there wasn't much money, there weren't many transactions. The price moved away from that area, leaving pending transactions, and then returned
[04:43] to activate them. This is something different here because it's an order block. There may there is a final contrarian candle, then a strong move is possible. That's something a little different from supply and demand zones. In supply and
[04:55] demand zones, we will generally find price accumulations in the creation of the zone, like this. We're going to find that we have candles going up, candles and this is an accumulation zone. What we are going to
[05:08] candles that are in the area in a small square like this and extend it so that this square can be used in the future. And it is used in the same way as order blocks, so that once it reaches this
[05:22] price zone, orders are activated and the price starts to go down or up depending on whether it is a supply zone or a demand zone, because if it is a supply zone it will always be at the top, if it is a demand zone it will always be at the bottom.
[05:34] In other words, resistance levels would be supply zones, and support levels would be located above, and supports are located below. The goal is for the price to reach these supply or demand zones and
[05:46] block, as if it were an important zone. We can find the same thing, for example, right here at this specific point. We see that the price tried to go up again, then tried to go down. As soon as you see two or three candles going up
[06:01] it's automatically a supply and demand zone. We enclose the entire area in a small square and extend it with the objective that in the future, once supply zone, it will begin to react in the same way, as if it
[06:17] important zone. In this case, notice that it's not so much a demand zone, which is the bottom part, but rather an order block. We're going to remove it because it's not the objective of the video, but this is indeed a demand zone because
[06:30] , then down, then up, and all of this here is a demand zone. The goal here is to see the price return to this demand zone and have this strong reaction in the opposite direction. And where would
[06:46] that reaction end? generally at highs or lows, just like talking about the same concept of institutional trading. The same thing happens here, for example, notice that this whole area in this part here is an area that is
[06:59] accumulating. Here we see a candle going down, a candle going up, a candle going down, a candle going accumulations, that is, where the price doesn't decide on a direction, you're going to enclose all these candles, you're going to extend it with the goal that in
[07:11] the future the price will reach that zone and use it. Here we would have an order block zone that we would eliminate for the moment, but notice here that we have have candles that go down, candles that go up, that go down, that go up, forming
[07:26] this special zone. This, my friends, is a concept that differs a little from order blocks because sometimes when we have a last opposing candle it does not reach the last opposing candle, but the price does reach the
[07:39] help us to mark the entire zone instead of just marking the last opposing candle. For example, if we at this point here, in this last opposing candle, notice that this is the last opposing candle, the green one,
[07:55] after the red movement, the price does not reach that area. But if we mark the accumulation zone, the price does arrive. That's why we need to master both methodologies. So how did we end up entering these points that we call
[08:09] the same way we would do it with any strategy, with identify my supply and demand zone, which I like to do on the remember that these zones are directional zones , I will now apply some
[08:23] entry strategy such as a structure breakout, a new order block, or simply a candlestick that indicates to me that the price is strong at that point with the objective of taking the entry. And it would be as follows. I can go to
[08:36] the 5-minute timeframe and once the price touches the zone, like here for example it touched the zone in the London session, I'm going to wait for the price to create a strong candle, an engolfing, a candlestick pattern, break
[08:49] the structure or make one or two entry confirmations. I could do it in 5 minutes or I could do it in 15 minutes. In both timeframes it would be totally valid because both timeframes are
[09:01] short timeframes. If I look at it in 15 minutes, I observe that the price arrives, it touched, it created a hammer-style candle for those who know about candlestick patterns and then something like an evening star candlestick pattern which would be like this. I
[09:15] candlestick patterns, but I know it's very popular in trading communities to use them. Therefore, if you want to combine it with that strategy, it's valid. What I would have done would be different. For example, I would have chosen a breakout order block
[09:29] , for example, in this area, I would have marked it here and ended up entering a little lower. This is me, and perhaps some explained in this video, but you can easily
[09:42] candlestick pattern here or even when it first appeared in this part here. If we look at the previous day to capture the same example, notice that more or less the same thing happens here . The price arrives, but the
[09:56] moment it creates a candlestick pattern or a strong candle that indicates to me that at that moment the price may rise, that's it. Here we have a green candle. I can take my entry right after this green candle here, put my stop loss
[10:09] below the supply zone, the demand zone in this case, because it's for buying, and put my take profit at the high of the previous day. I'll take a one-to-two entry here. The goal is for you to be able to identify these
[10:21] high timeframes such as the one-hour timeframe and then use the short timeframes to identify the entry point. We're example, if you are waiting for the entry point at this point, after you
[10:36] identify this supply zone, what you have to do is mark this candle, which would be the giant candle that comes in the opposite direction, or this one that ends up enveloping the green one, and then you end up entering. Another thing they can
[10:49] you can mark this last opposing candle, then the movement and mark this green order block with the objective of entering when the price returns to the order block around this area and place the stop loss up here and we place
[11:03] our take profit down here, below the previous day's price with the Notice that, well, this time if we put the take profit down here it would n't reach that much, it would be a one-to-one entry that gave the movement,
[11:16] but perhaps in this case as part of the probabilities let's say that the entry was lost. Alright? We're going to accept a loss. Let's see here on this day, this one being the previous day, we are using the offer zone from the
[11:29] engulfing candle like this one here, enter, place our stop loss above the initial point where we are entering, and then place our take profit below, right here below. We can even set our
[11:43] stop-loss a little higher, actually, like in this area, because this is the area . Then we can go back to the previous day to observe exactly the same example. Today we are observing that once the price reaches the zone
[11:55] of the previous day, which is this zone here, look at it here, once it arrives, it begins to react with strong candles towards the opposite side. And we can take our that ends up enveloping this one together with these three, put our
[12:09] stoplos up here and our take profit down here. And it literally means doing the exact same process over and over again. The main thing will be to identify within the time frame of one hour this supply zone or this
[12:22] demand zone, as here. Sometimes it will be cleaner than others, like this time. Notice that once the price reaches the supply zone, the next candle, which is the engulfing candle, gives me my entry confirmation. I place my
[12:34] stop loss above the supply zone and my take profit below the low of the previous day, and that's it. In this way we not only demand zone, but we also identify how we can enter it. This
[12:47] was just one perfect example, but we can find all these previous days and see the same thing. And the main objective is to mark the isilops of previous days to identify our direction point, and then we
[13:00] will use the supply and demand zones to look for supply and demand zones will be like this. Notice that it's accumulating all the time, and even though it goes up a little, it's all accumulation.
[13:14] from the lowest part of the accumulation to the highest part and extend it with the objective that the price will then use it as it does here more or less. Sometimes it will be very precise, sometimes it won't be
[13:27] do to identify the exact entry point is to go to the 15-minute or 5- minute timeframe and look for that entry confirmation that tells me the area is valid for use. You can
[13:40] keep looking for this concept over and over again within the graph and you will always But the important thing is that you understand the concept, that you know this is not just a simple zone, and that you know the reason why we are selecting these
[13:53] accumulation points. The answer is because in accumulations there are neither suppliers nor demanders, and in these accumulations, when the price leaves these supply and demand come in. That's why these areas are special, because the price
[14:07] tends to bring them back, because they were areas that were dead, but something happened, some transaction that revived the area, creating a point of demanders. And these are the supply and demand zones. I could stay in
[14:20] this video and explain with pure logic exactly how more useful if we look at it in a practical way on the graph and how you can identify it. Remember, the trick here will be to identify
[14:34] going up or down much. And in these accumulation zones we're going to enclose it in a small square with the aim of using this as a zone in the future so that when the price revisits that zone it ends up giving me a move in the
[14:47] And accompanied by an entry timeframe like 5 minutes or 15 minutes, I'm going to use these supply and demand zones to improve my trading style and strategy. If you use
[14:59] order block strategy, your smart money strategy, which I literally on this YouTube channel, you can learn institutional trading If you implement this strategy along with others I've already explained, your trading will
[15:14] improve exponentially. Not only will you identify areas where work or sometimes don't reach, but you'll also have a more complete trading style. As you know, since the market is made up
[15:27] financial assets have people who buy and people who sell. These are offers and demands. Greater supply leads to greater demand, allowing the market to every person who sells, there has to be a person who buys, and the money
[15:41] trading, that same money is being lost by someone else in another part of the world, because that's how it works. If you lose money one day, someone else is earning , someone else is losing the money you're earning. They are
[15:56] everyone wins in transactions. So if you enjoyed this video and would like me to make a supply and demand zones and how you can take more entries with different entry strategies, let me know in the comments and I'll gladly do it. And if
[16:10] help you turn trading into your biggest source of income, below this video I've left a form and a member of my team will contact you if you apply. With nothing more to add, see you in the next video. Leave me a
[16:23] comment and a like. Bye, bye and kisses.



⚡ Saved you 0h 16m reading this? Transcribe any YouTube video for free — no signup needed.