
VWAP Buy Signal Strategy
45sShows a clear, actionable buy setup with VWAP indicator, easy to replicate for viewers.
▶ Play Clip"Title accurately describes the content: ten strategies explained in 14 minutes."
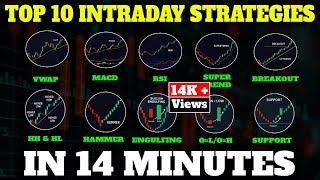
This video presents ten intraday trading strategies for the stock market, explained in Telugu. Each strategy is demonstrated with chart examples, focusing on entry, stop loss, and target placement to achieve a 1:2 risk-to-reward ratio.
Buy when price crosses the indicator from below and closes above it. Sell when price crosses from above and closes below. Target is 1:2 risk-to-reward.
Use MACD indicator. Buy on clear buy signal (histogram green), sell on sell signal. Set stop loss and target 1:2.
Apply Super Trend. Green line indicates buy, red line indicates sell. Target 1:2.
In a downtrend, a hammer candle (small body, long lower wick) signals reversal. Buy above the high of the hammer candle, stop loss at its low, target 1:2.
Look for higher highs and higher lows pattern. Buy when previous high is broken by a green candle. For selling, look for lower highs and lower lows.
First five-minute candle of the day where open equals low. If a green candle forms and breaks the high, buy. Target 1:2.
First five-minute candle where open equals high (big red candle). Sell below the low, stop loss at high, target 1:2.
Bullish engulfing: red candle followed by larger green candle in downtrend. Buy above green candle. Bearish engulfing: green candle followed by larger red candle in uptrend. Sell below red candle.
Draw trend line connecting lows. When price touches support and forms a green candle, buy above that candle. Target 1:2.
Draw resistance line connecting highs. When price breaks resistance and forms a red candle, sell below that candle. Target 1:2.
Apply RSI indicator. Buy when RSI touches 30 and shows reversal with a green candle. Sell when RSI touches 70 and shows reversal with a red candle. Target 1:2.
The video provides ten distinct intraday trading strategies, each with clear entry, stop loss, and target rules. The consistent theme is a 1:2 risk-to-reward ratio, emphasizing disciplined trade management.
What is the target risk-to-reward ratio used in all strategies?
1:2
01:01
In the Wrap strategy, when do you buy?
When price crosses the indicator from below and closes above it.
00:03
What does a green line in the Super Trend indicator indicate?
Buy signal.
03:39
What is a hammer candle and in which trend does it appear?
A hammer candle has a small body and long lower wick, appearing in a downtrend as a reversal signal.
04:46
In the price action strategy, what pattern indicates a buy?
Higher highs and higher lows pattern.
06:06
What is the condition for the 'Open Equal to Low' strategy?
The first five-minute candle of the day has open equal to low, and a green candle breaks the high.
08:10
What is a bullish engulfing pattern?
In a downtrend, a red candle is followed by a larger green candle that completely engulfs the red candle.
09:58
How do you trade using the support strategy?
Draw a trend line connecting lows. When price touches support and forms a green candle, buy above that candle with target 1:2.
11:05
What RSI levels are used for buy and sell signals?
Buy when RSI touches 30 and shows reversal; sell when RSI touches 70 and shows reversal.
13:06
1:2 Risk-to-Reward
Consistent target across all strategies emphasizes disciplined profit-taking.
01:01Super Trend Simplicity
Indicator provides clear color-coded signals, easy for beginners.
03:39Hammer Candle Reversal
Classic candlestick pattern for spotting trend reversals in intraday trading.
04:46Engulfing Patterns
Strong reversal signals confirmed by volume and candle size.
09:58RSI Overbought/Oversold
RSI at 30 and 70 levels provide objective entry and exit points.
13:06[00:03] The first strategy comes and we buy above the candle high. The first strategy comes and it is a wrap strategy. This is an indicator apply it. See here. Go to the indicator section. After going there,
[00:18] Go to the indicator section. After going there, See here. Apply it. Just tap and it will be applied. No matter which trading platform you use, there will be an indicator section in it
[00:32] . Once you have applied the strategy, if the price crosses the indicator from below and closes above the indicator, we Friends, please observe this cone stick pattern once. If you
[00:47] look clearly here, a green candle has formed above the vaping. Look, it's cut from the bottom and shaped like that. In situations like this, we can plan for buying. Okay, so we buy at this candle high and
[01:01] then we put a stop loss at this point. The target is 1:2. When we get 1:2, we exit. It could be 1:3, it could be 1:4, it could even be 1:5, but intraday, 1:2 is very, very great. So just
[01:16] observe now whether 1:2 will come or not. So after we entered, we will make a profit within two or three candles . So if the price crosses the indicator from above and
[01:30] closes below the indicator, you can sell and buy later. Look here, this red candle touched the indicator and closed below it. means I have a short position. I will sell it here in this particular place. So
[01:42] before that, we will place a stop loss until the high. Observe the 1:2 ratio . If the market slowly falls, it's okay, so our target is easily reached here. SecondMACD Strategy This is also an indicator
[01:56] . Go ahead and type MACD here. Type MACD and it will come up. Just tap here and apply. Let's now see . Friends, observe this consistent pattern
[02:09] . The MACD indicator here has given us a clear buy signal, so if we buy at this particular place, . So here I will take this long position and in the meantime I will put a stop loss,
[02:22] 1:2 target, okay, now you observe whether our target will be reached or not, okay, so the market will go up. If the ACD is also in the green, it will form, look at those histograms, it means that
[02:34] Now, I took 1:2, but many people will exit even at 1:5. So finally, our target has been reached. That means if we put a 1000 stop loss here, we will get a profit of ₹2000, which is definitely a 1:2
[02:48] risk-to-reward ratio meaning that, as well as first selling and then buying. Now let's see. Friends, the MACD has come up and do it if we sell here. Short Position Here we will take a short position near this particular place
[03:01] we will set a high before the stop loss arrives . We'll keep it high for now. We will exit with a target of 1:2. Okay, okay, if the market goes down, it will come back. Okay, okay, if the market goes down, it will come back. Okay, okay, if it slowly rises again, it will come back
[03:14] not, the stop loss is hit, and sometimes the stop loss can also be hit. We definitely need to take it easy, but look here, friends, we hit our target here and the
[03:26] . The next third strategy is the Super Trend Indicator. So you go to the section and apply the super trend. Super trend, so just tap on it and it will be applied . No settings are
[03:39] appears, it means buying, and if a red line appears after that, it means selling. Just observe this chart here appears after that, it means selling. Just observe this chart here turns green, we can plan to buy . If we have been
[03:54] given the green light here, we will plan to buy here immediately. So buy at this particular price, exit. Look at the saying that 1:2 is very great intraday, and that
[04:08] is very great intraday, and that . Similarly, let's look at buying after the first selling. The next step is to observe the candlestick part . There is this green
[04:20] line, right? When it turns red, we sell and then buy . If we get a red line here, the sell at this particular price, we will take a short position. So, we will
[04:33] we will take a short position. So, we will Whenever our super trend turns into a red line here, . Because we got buying from here, the next
[04:46] exit. The fourth strategy is the hammer candle. . So the market is currently in a downtrend. So, candle forming in a downtrend,
[05:00] . So, observe this particular candle here. You see this particular So, I will plan to buy here immediately. So, for a long position, buy above the high of this candle and place a stop loss on this same candle.
[05:14] stop loss on this same candle. three to four candles. So, if a hammer candle
[05:26] powerful. So let's see the reverse as well. Now just observe this candlestick pattern. So friends, if you notice here, this means that we have a reversal in the downtrend. The Hamir candle has formed in reverse, so we
[05:40] plan to sell here. We will sell this particular base . So far, we'll set a stop loss of 1:2 and exit at 1:2. Okay, so far, just observe now. Slowly but surely, our target will be reached. Okay, okay, look, it has arrived
[05:53] . The fifth one is a price action strategy. First we buy and action to sell. That means we will follow a pattern. Similarly, we means we will follow a pattern. Similarly, we
[06:06] live now. Look at the pattern of higher higher higher. Look at this. red candles are forming. Just keep observing this pattern. It's
[06:22] you notice here, check here, one pattern has followed us, look here, it grew like this from here, then fell here, then grew again, then fell here again. So this is a pattern. Which pattern is this?
[06:35] Higher higher higher lower pattern. So what we do in situations like this is that whenever the previous high cuts us, we plan an entry said. This previous high was cut by a nice green candle. So
[06:48] . Long Position: In this place we take a long position. We place a stop loss at that candle . When the target arrives, take 1:2 and look here, our target has been reached. We have a price above our target.
[07:02] here. If we go this far, we have almost reached 1:3. So this is very, very good price action. Let's see the next selling side, that is, a lower high, lower low form. Just
[07:17] tell you where to enter. I in a downtrend, but if the market slowly goes down, it will fall. Lower market will fall, then slowly rise again, then fall again. Just
[07:32] observe. I will give you an entry point. Look here. So if you see this pattern, look here. The market fell like this from here. So I will draw and show you. The market fell like this from here, then rose a little, then fell again, then
[07:44] market fell like this from here, then rose a little, then fell again, then falls like this from here, then you can plan for selling. So just observe. It has fallen now, so I will sell here. The short position is
[07:56] in this place. So so far, my stop loss is 1:2 target. Okay, the market will fall down. So if it comes towards our target, it will come. If you're just observing, we have to wait. So almost our target was a hit here
[08:10] . Our target is almost there. This way you can . The sixth one came in open equal and the open equal to high . A green candle has formed here, so this is the
[08:26] first candle of the day, meaning the price did not fall below this first five-minute candle . So what happens in such cases is that the open and closed ones are the same. So just pattern, look here, if the market goes up, it will go up. So if
[08:40] you notice here, the candle broke the high earlier, now we will plan for entry, long position, we will take entry at this particular place, we will place a stop loss at that candle, we will set a
[08:54] 1:2 target and exit . Look, our target has finally been reached. So in this way, when you are in the open equal to, you buy first and then sell. Next comes the open equal to high strategy.
[09:07] Here we have a big red candle formed, right? It is the first five- minute candle of the day. So what happens here is that the open and high are the same. Both are the same. In such cases, we first sell and then
[09:19] keep observing this candles part. Look here, sell here immediately, that is, we will take a short position here, we will take a short position here, we will set a
[09:31] target is usually 1:2 and we will exit at 1:2, look at this so far, just observe here, so let's check if our target will be reached or not . Look, it looks like it took a little while . So finally, our
[09:46] target has been reached. This way you can plan your trade. Seventh one comes and bullish engulfing strategy as well as bearish engulfing strategy. First we will look at the bullish engulfing strategy. So for that, just observe this pattern here. If
[09:58] the market is in a downtrend, it will appear. So friends, look here. If you observe this chart pattern, look here. So in the downtrend, here we have a red candle next to it that has been completely eaten by a green candle.
[10:12] So if it forms like this, we will say that it is a bullish engulfing pattern. In such cases, we can directly take a long position we plan our entry on this green candle,
[10:24] we take a stop loss on the same green candle, set a target of 1:2, and exit. Now you observe that if you enter three to four . So this is a bad angle firing pattern. Similarly, let's
[10:37] look at the bearish EM Fi pattern. So the market is in an uptrend now . So friends, look here, you have We call this a bearish yingling pattern . In such cases, we
[10:51] . We will sell at this particular price . We exit . So, if our target hasn't been reached yet, we'll wait. Okay, here it is, look, this is how you
[11:05] can plan your trade. Eight One is a support strategy, which means we should learn how to trade near support . Since we need to we first need to draw a trend . The price rose from here and then
[11:18] rose again from here. So let's draw a trend line by joining these two points like this. Let's . If the price touches this trend line and gives confirmation,
[11:32] we can plan to buy. Just observe and I'll tell you. So if you look here, you have clearly come to us with a confirmation a good green candle and it has formed.
[11:44] So we will immediately buy above this green candle and put a take a target of 1:2 and just observe that when we entered, the next
[11:57] . Let's learn how we can trade near resistance as the ninth one arrives . So first we need to draw a resistance line draw a resistance line, joining it from here like this.
[12:10] Okay, so I'm going to draw a resistance line like this. I'm going to draw a resistance line like this. . Friends, just
[12:23] break our resistance line and form a good red candle, we can now plan to sell at this particular place, that is, take a short position. If we take a we will place a stop loss until the red line is high. The target is 1:2,
[12:38] that is, 1:2, which means that we will get there so far. So our target will be reached within 3 Tufa way you can take a trade plan. So finally the 10th one is the RSI strategy, this is an
[12:52] apply the indicator, here you go to the indicator section, from here you type RSI and apply it, since RSI stands for Relative Strength Index, you apply it . So you
[13:06] can check the RSI indicator below. Similarly, if we have a range in the RSI indicator, say from 30 to 70. When our RSI indicator touches the 30-point range,
[13:22] here, just observe. Observe the consistent pattern above. Below you can observe the RSI indicator. Look here. The RSI indicator shows us that it is going to go up. Also,
[13:34] we have a nice green color near the cone stick pattern, but it has become a form. So, . We will buy at this price . So, let's say we set a stop loss and exit with a 1:2 target . Look at 1:2,
[13:47] which means it comes this far. No, you can do it if we wait until you reach 70 points . It's up to you to decide if the market will slowly rise. So, if we are targeted, we have arrived. See here. Similarly, if the PriceRSI
[14:00] indicator goes near 70 and we feel like it is going to turn sideways, we can sell. I will show you that too now. So now if you RSI indicator has
[14:12] touched 17. Now look, if you touch 17, it will come down. Now we can plan for selling. So, so far, the stop loss is set at 1:2, the target is set at 1:2, okay, observe, now see if the market goes
[14:25] down, does it come up, or does it go up again, okay, if it goes down again, does it come down again? So, our target has been reached. So you can plan your trades based on the RSI indicator in this way.
⚡ Saved you 0h 14m reading this? Transcribe any YouTube video for free — no signup needed.